
The long discussed, long promised CritterWatch 1.0 release finally happened yesterday, and it's already in use by some of our clients. We'd like to thank all of our clients who helped us with feedback and trial usage in the past several months.
CritterWatch 1.0 shipped on August 19th. We launched it live, and the whole walkthrough is here:
The pitch
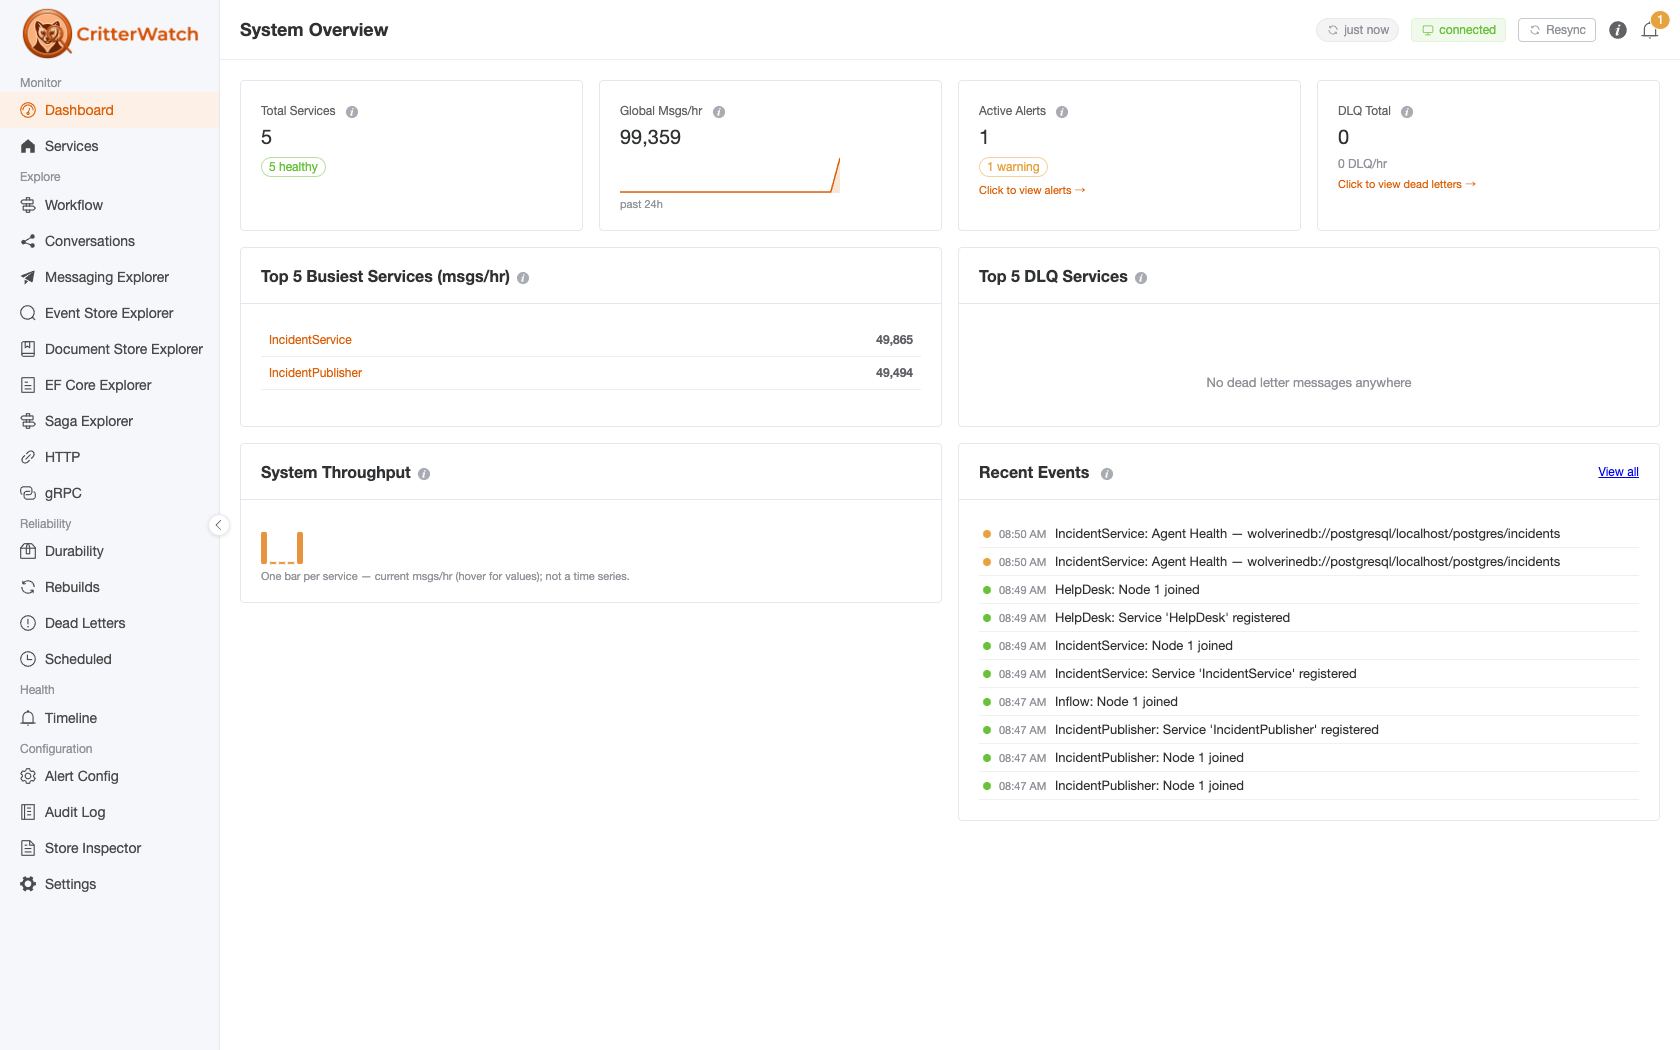
Generic observability tools see your Critter Stack application as a pile of HTTP requests and database calls. They can tell you that a request was slow. They cannot tell you that your OrderProjection is forty thousand events behind, that nine messages died on a poison payload an hour ago, or that the aggregate you're staring at came out shaped that way because of one event at version 47.
CritterWatch knows what a Wolverine handler is. It knows what an async projection daemon is, what a dead letter queue is, what a saga is, and what an event stream is. It is built by the same people who wrote those things, against the same abstractions, so it doesn't infer your architecture from telemetry — it reads it from the running system and shows it to you.
And it doesn't stop at showing. Almost everything CritterWatch surfaces, it can also act on: replay the dead letters, rebuild the projection, pause the listener, add the tenant — from the console, with no code change and no service restart. That's the part that turns a 2am incident into a five-minute fix.
See the system you actually shipped
We know that this feature will probably take a few more revisions and more user feedback to be really effective, but we're on our way!
CritterWatch is as much a development tool as a production one, and this is why.
It renders live event models — commands, events, projections and the handlers that connect them — assembled from the code that is running right now. Not from a diagram somebody drew a year ago and stopped updating in month three. Alongside that you get your real store schema and DDL, the handler and projection source Wolverine actually generated, and full HTTP endpoint chains including every piece of middleware in the order it will execute.
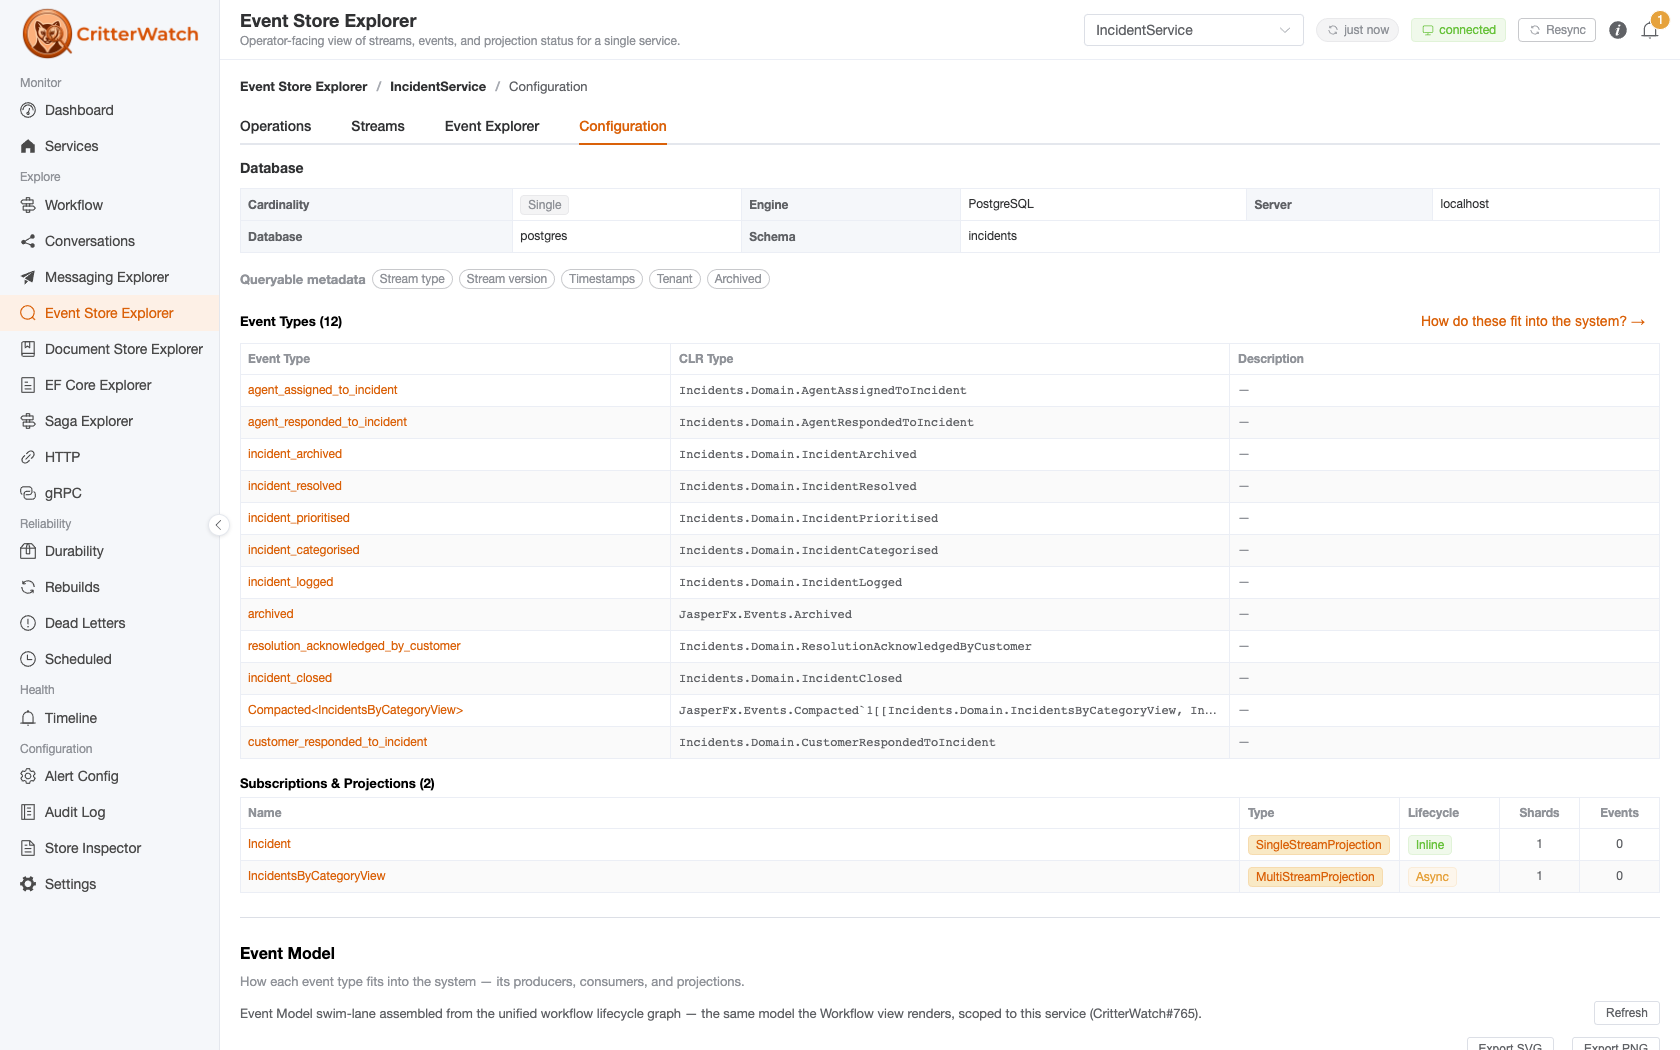
For onboarding a new developer, or for answering "wait, what happens when this message arrives?", this is worth the price on its own. It is ground truth instead of folklore.
Step through a projection, event by event
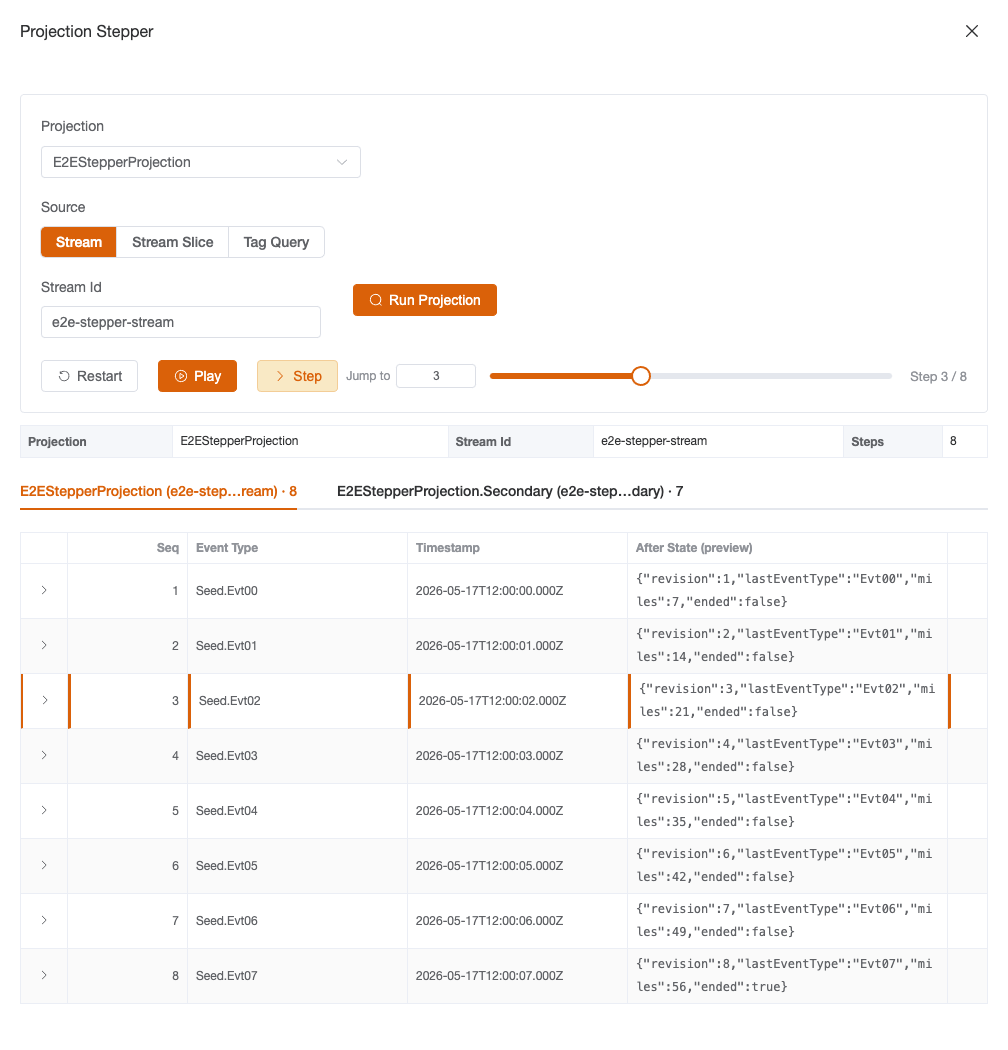
The Projection Stepper is the feature people tend to fall in love with first.
Point it at a real slice of your event store and it replays the projection in front of you, one event at a time, showing the before and after state at every step with a JSON diff. When an aggregate is wrong and you cannot work out why, this collapses the usual archaeology — clone the database, write a scratch test, add logging, redeploy — into a few clicks against the events you already have.
Fix the dead letter queue instead of dreading it
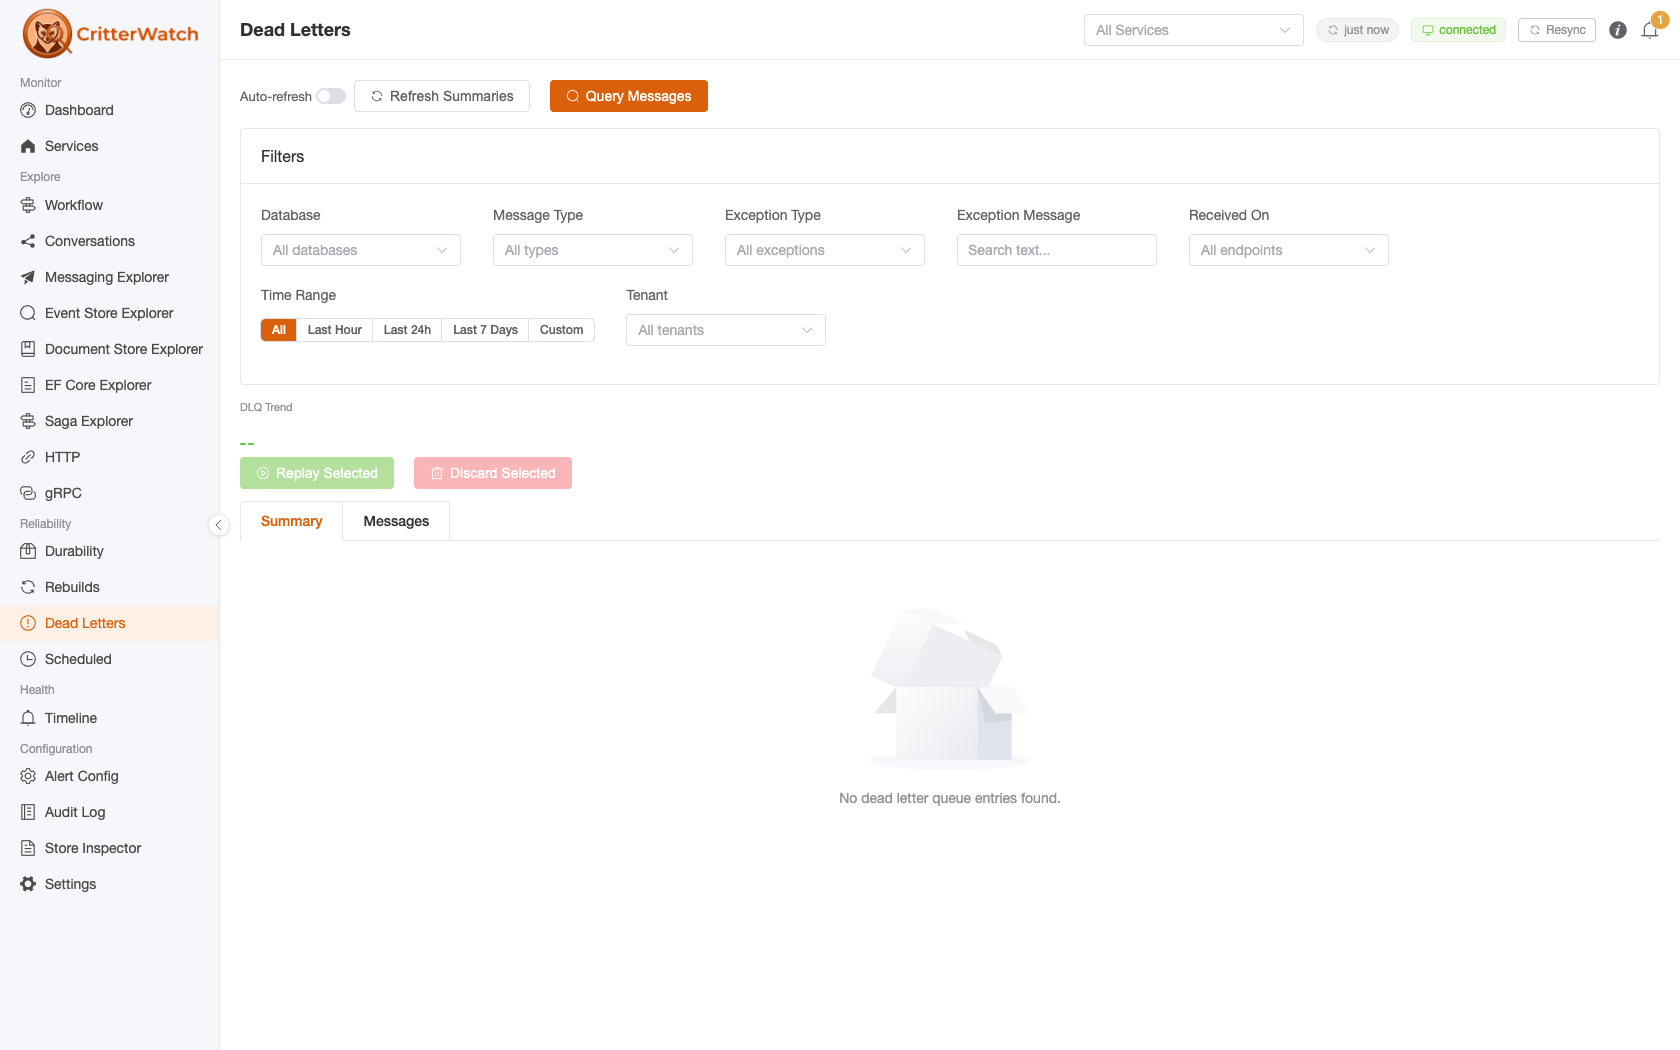
Dead letters across every monitored service, in one view: query and filter them, group them by exception so a single bad deployment reads as one problem rather than four hundred, and then replay, edit-and-replay, or discard — individually or in batches — with a CSV export when somebody needs the paperwork.
The projection side works the same way: watch async projection lag, spot the shard that has stalled, and pause, restart, rebuild or rewind it from the console. No code change, no redeploy, no connecting to production with a SQL client and hoping.
Alerting that remembers what happened
CritterWatch's alerting is event sourced, which is exactly the dogfooding you'd expect from us — and it earns its keep. An alert has a full lifecycle: raised, elevated, reduced, resolved, cleared, all stored as immutable events.
That means the history is auditable. You can answer "how long was this actually broken, and who did what about it?" a month later, which a current-state table that overwrites itself simply cannot do.
Multi-tenancy runs all the way through: add, disable and remove tenants at runtime, with per-tenant metrics, dead letter filtering and projection health.
Hand your AI agent the controls
CritterWatch ships an MCP server. Point Claude — or any MCP client — at one endpoint, and your agent can query every monitored service in your fleet: spans by saga or stream, projection lag, dead letters, alerts, metrics. And it can act, tenant-scoped and RBAC-gated, within whatever permissions you grant it.
This is the piece we think ages best. Giving an AI assistant a real control surface over your distributed system is only reasonable if that surface is typed, permissioned, and auditable. That is a very different proposition from letting an agent loose with a database connection string, and it's why the MCP server was built into the product rather than bolted on afterward.
Getting it
Install the package matching the database you want CritterWatch's own console storage to use. This is independent of what your monitored services run — a console on SQLite can happily watch a fleet of PostgreSQL-backed services:
| Package | Console storage |
|---|---|
CritterWatch | Marten / PostgreSQL |
CritterWatch.SqlServer | Polecat / SQL Server |
CritterWatch.Sqlite | Fisher / SQLite |
dotnet add package CritterWatchThat last row is newly practical: Fisher hit 1.0 the same day CritterWatch did, so you can stand up a full console backed by a single SQLite file with no database server at all — ideal for local development, demos, and single-node deployments.
Monitored services add Wolverine.CritterWatch, which is deliberately store-agnostic: it depends only on the JasperFx.Events abstractions, so a service on RavenDB, EF Core, or no event store at all can still be monitored. The Quick Start will have you looking at your own system in a few minutes.
What it costs
Read-only monitoring is free, for as many services as you like, with no license key at all. Point it at your entire fleet and watch nodes, agents, projections, dead letters and throughput across every service — that costs nothing and always will. Go do that first; it's the honest way to find out whether this is worth anything to you.
A commercial license unlocks the parts that do things: every operator action (dead letter replay, projection rebuilds, listener and node control, tenant management), alerting, audit logs, custom thresholds, multi-tenancy, and the entire MCP server. Tiers and current pricing are on the CritterWatch plans section of our products page, with a buy link on each. If you'd rather try before you buy, ask us for a trial license.
If you're already weighing a support contract, do the arithmetic the other way around. Every JasperFX support plan offers CritterWatch as an add-on, and the Premium plan includes it outright — along with hours of consulting, a private Discord channel, and direct access to the people who wrote the framework. For a lot of teams that bundle is better value than a license alone.
Where to go next
- Documentation — critterwatch.jasperfx.net, including the full 1.0 release notes.
- Report a bug or request a feature — the JasperFx/ProductSupport repository is the public issue tracker for CritterWatch and our other commercial products.
- Come talk to us — there's a dedicated #CritterWatch room in the Critter Stack Discord, which is the fastest way to get a question in front of the people who built it.
1.0 means the API surface, the package lineup, and the storage model are stable and supported. We have a long list of things we want to build next — but this is the release where we'd like you to start using it in earnest, and to tell us what it's missing.