JasperFx Software is proud to announce a new pre-1.0 release of "CritterWatch" today. Our plan is to release CritterWatch 1.0 on Monday, June 15th. CritterWatch is available on Nuget with the BSL license. Many read-only features are usable as is, but a commercial license will be required for the full functionality including the MCP integration.
A purpose-built monitoring + operations console for the Critter Stack — production observability, development-time insight, and an MCP control surface built for AI agents.
CritterWatch 0.8.0 is the largest release we've cut so far. If you run Wolverine — with or without Marten and Polecat — this release pulls a lot of work that's been landing on main over the past month into a single coherent dot-release and shifts CritterWatch from "nice to have" toward something we'd put in front of a serious production deployment.
This post covers the three reasons we keep hearing for adopting CritterWatch, and ends with three side-by-side Getting Started walkthroughs — one over RabbitMQ, one over AWS SQS, and one that doesn't use a message broker at all.
TL;DR —
dotnet add package CritterWatch --version 0.8.0for the console host,dotnet add package Wolverine.CritterWatch --version 0.8.0in the apps you want to monitor, point them at a shared Postgres + the transport of your choice, and you're live. Examples below.
CritterWatch only supports PostgreSQL for its own storage right now, but we plan to add SQL Server support by the time of the official 1.0 release.
What is CritterWatch?
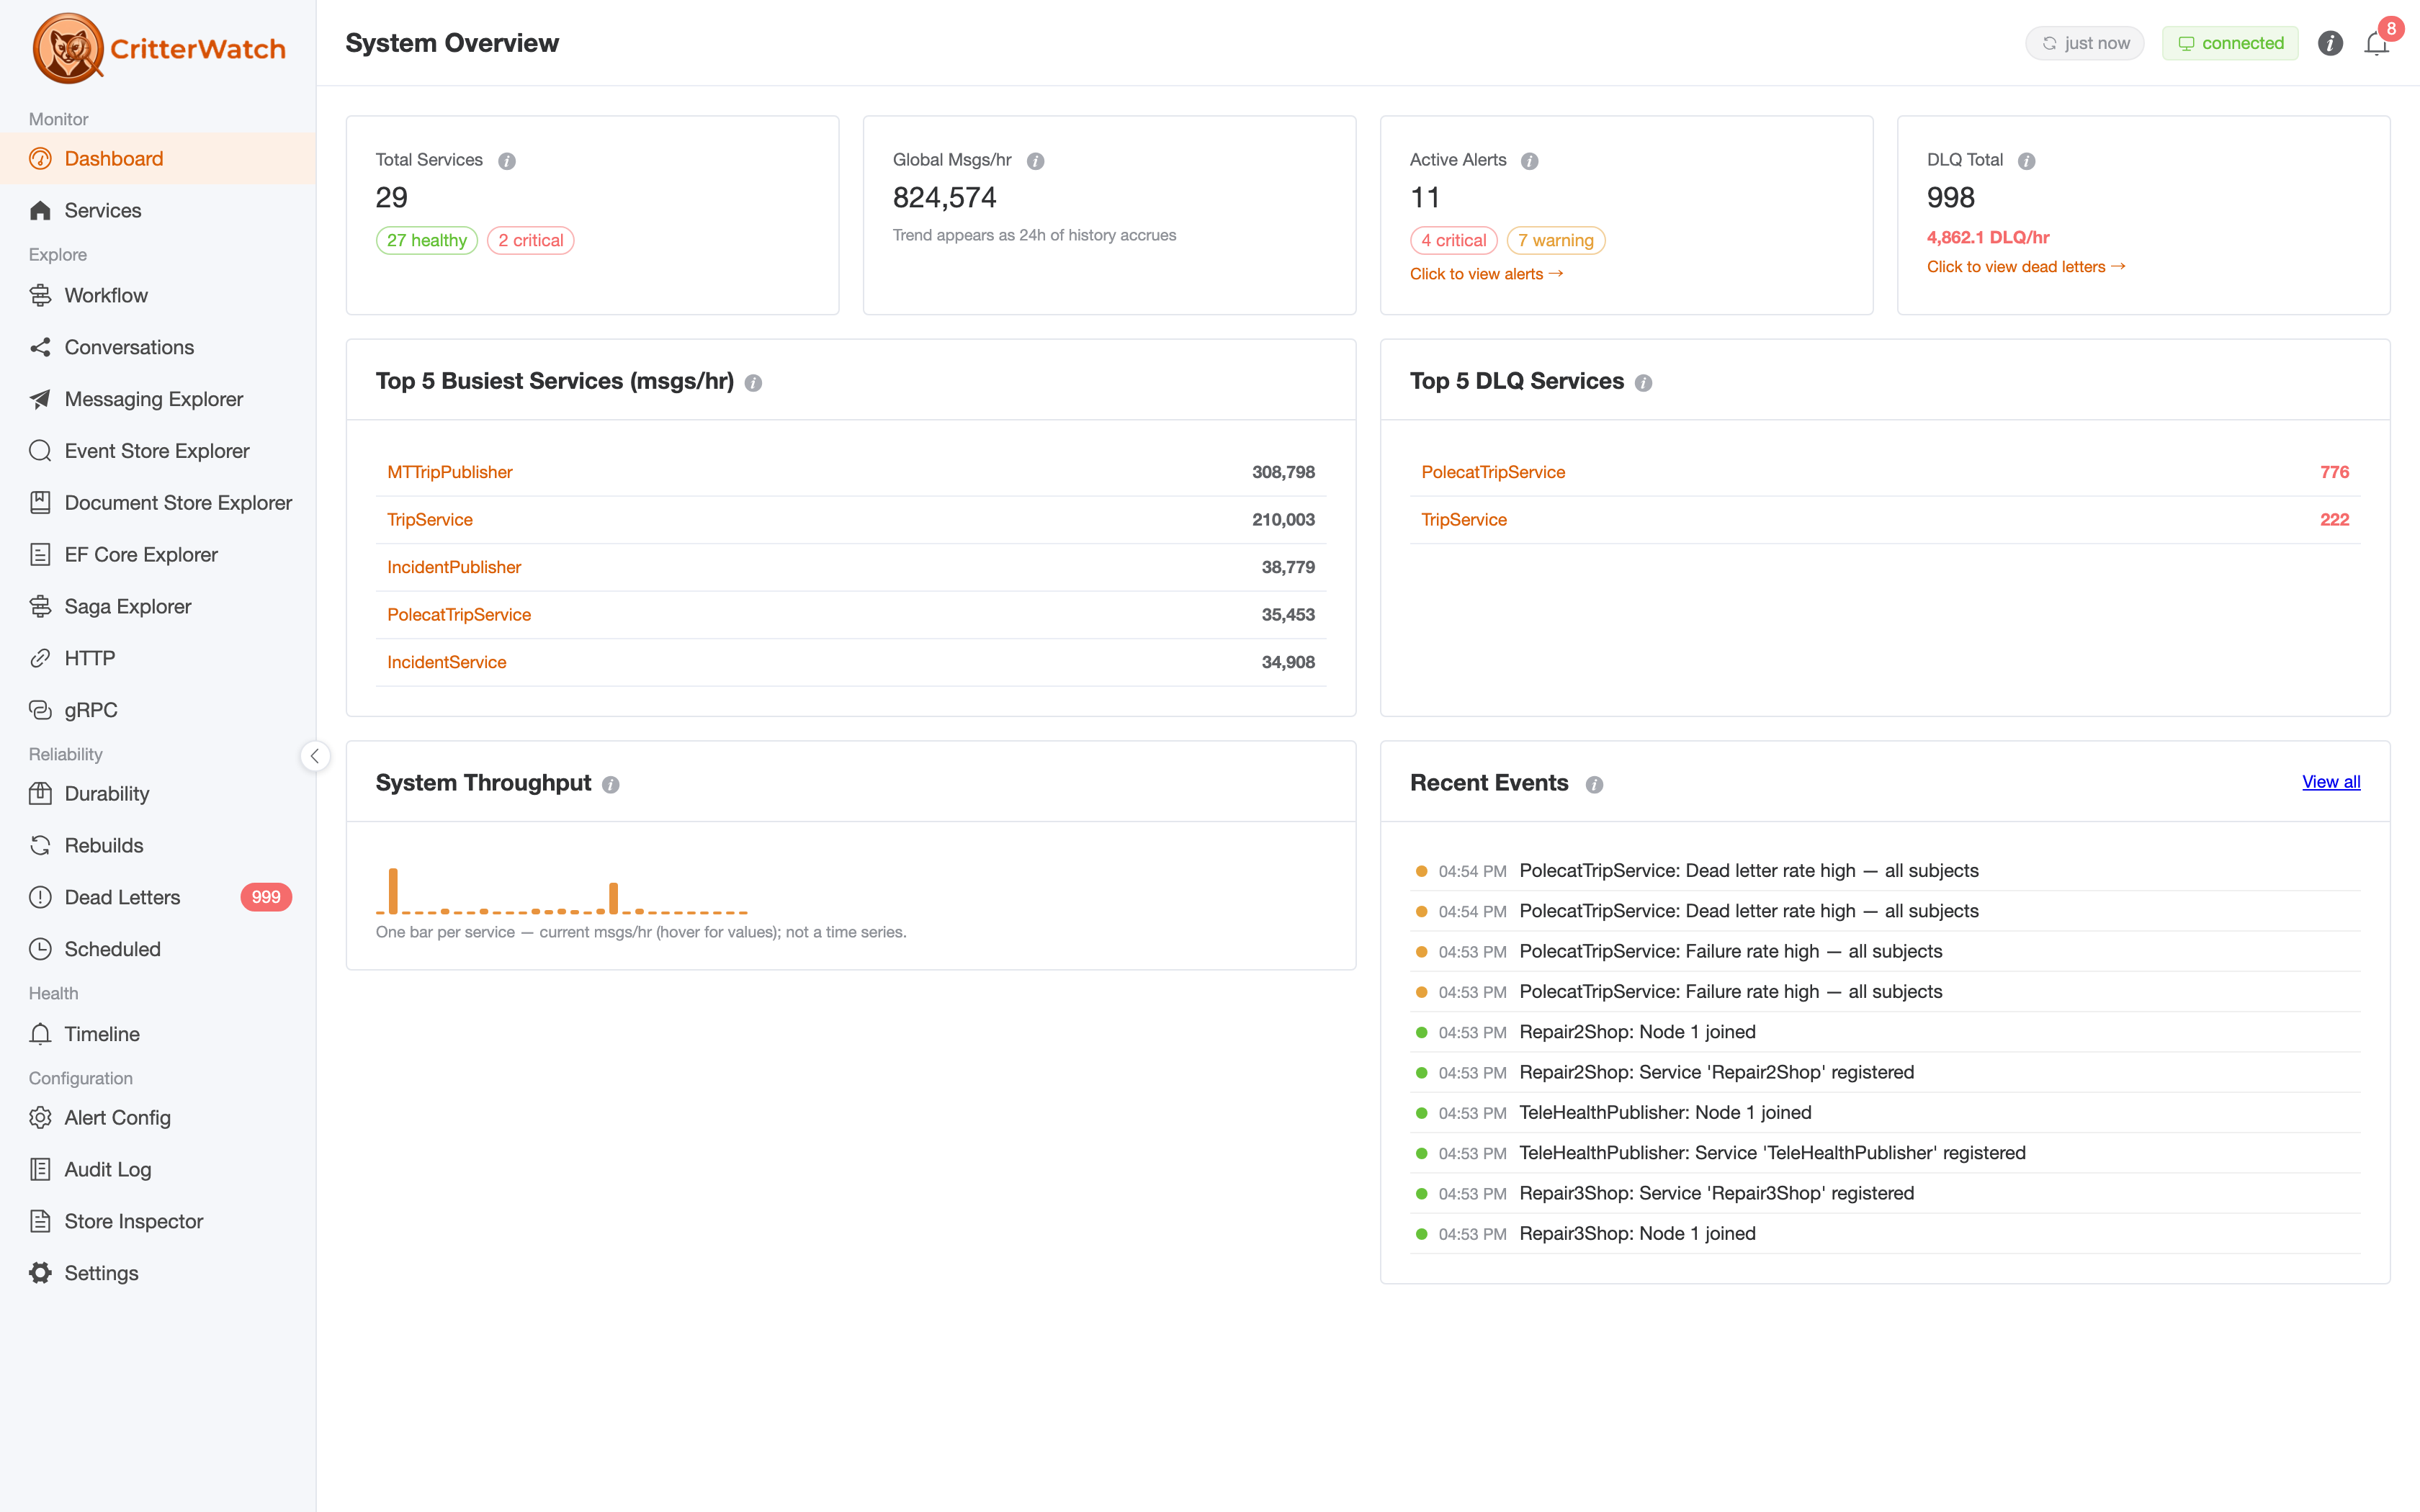
CritterWatch is a multi-application monitoring and operations console built specifically for the Critter Stack. Where most APM tools see "an HTTP endpoint" or "a SQL query," CritterWatch sees:
- Wolverine message handlers, listeners, agents, schedules, nodes, sagas, durability, and chaos.
- Marten / Polecat event stores, projections, shards, dead-letter events, async daemons, and per-tenant partitioning.
- The cross-application topology — every service, every node, every projection, all on one screen.
It's a Vue 3 SPA backed by a Wolverine + Marten BFF, packaged as a self-contained NuGet (CritterWatch) that embeds the frontend. You stand up the console, point each monitored Wolverine app at it with one line, and the console builds its picture of the world from the telemetry the apps publish.
Why CritterWatch
1. In Production — a real ops console, not just an informational dashboard
First off, CritterWatch uses Wolverine itself to communicate to the monitored Wolverine applications.
If you only use Marten today, you will have to add Wolverine just for CritterWatch communication -- but don't worry, that doesn't mean you have to use Wolverine for anything else in your system except for that!
Based on some early feedback and admittedly some reported problems, 0.8.0 adds:
- Flexible messaging options The ability to use messaging transports that place limitations on message size like AWS SQS or Azure Service Bus
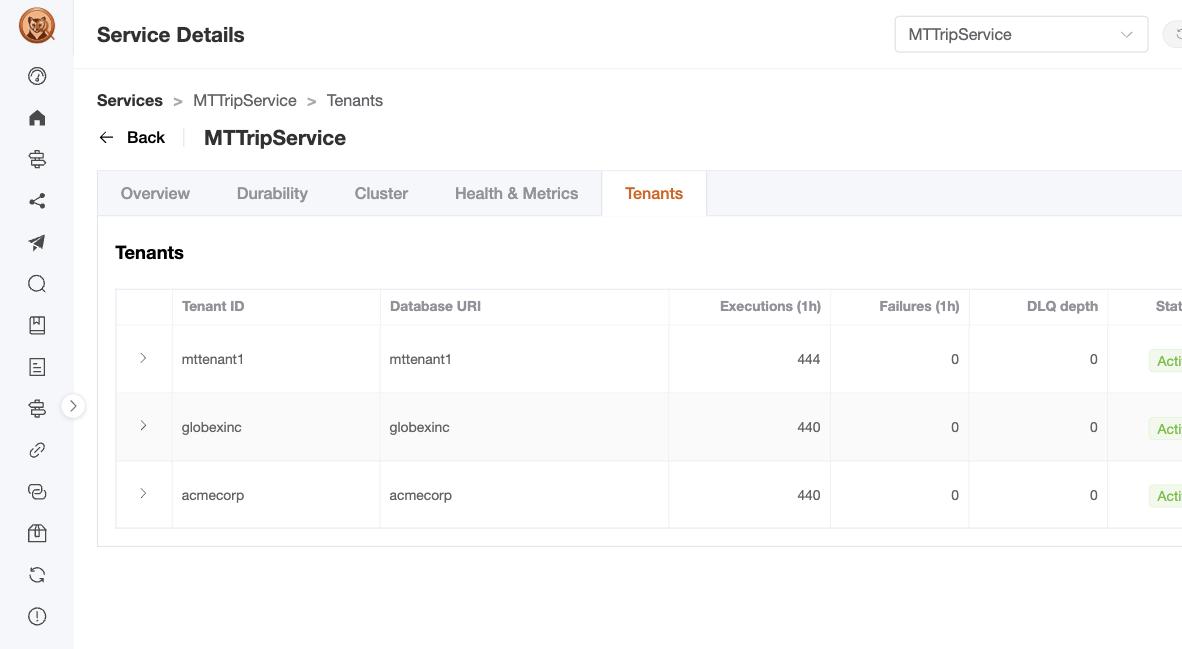
- Dynamic Multi-Tenancy Administration of tenants for multi-tenancy for shops that want to utilize the Critter Stack's ability to support "dynamic" multi-tenancy where you might want to add new tenants without system downtime
- The operator surface you actually need. DLQ replay / discard with per-message inspection. Projection pause / restart / rebuild — and per-tenant scoping on every one. Listener pause / restart / drain. Chaos-monkey controls for game days (and tests). A tenant lifecycle dialog with typed-id confirmation for hard delete. An audit log that records who did what, when, on which resource — keyed by the
ClaimsPrincipalfrom the host's auth layer. - Alerts that mean something. A taxonomy specific to the Critter Stack:
MetricsExecTime,MetricsThroughput,MetricsFailureRate,ProjectionLag,ProjectionStale,ProjectionPaused,ProjectionDeadLetters(new in 0.8.0 — wires Marten'sIEventStore.AllDatabases()for cross-database awareness),AgentDown,CircuitBreaker,BackPressure. Each one is seeded from declared baselines you can hand toAddCritterWatchMonitoringand refined from observed history. - OpenTelemetry-native. Traces are first-class. Span queries by saga id and stream id are on the roadmap; the trace-provider integration that drives them shipped a release ago.
- Opt-in, auth-agnostic RBAC. Off by default, so existing single-operator deployments don't change. Turn it on with
AddCritterWatchAuthorization<TAuthorizer>()and aClaimsPrincipal-based authorizer that maps your IdP's claims to a 49-entry capability catalog. Enforcement at three surfaces: HTTP endpoints (via[RequiresPermission]), MCP action tools (viaMcpAuthorizationContext), and SignalR-relayed Wolverine commands (via Wolverine 6.2+'sSignalREnvelope.Principal). Per-tenant scoping comes free — the resource string is{serviceName}:{tenantId}when you settenantId.
If you're running a single Wolverine app on one box, you can skip clustering and most of this. CritterWatch still runs single-node — enableClusterPartitioning: false and the cluster machinery turns off. But once you cross from "one app" to "several apps with several teams," the picture changes fast, and CritterWatch was built for that picture.
2. In Development
While we hope that CritterWatch is an attractive proposition for production support for Critter Stack systems, there are plenty of more general production monitoring tools out there. What we think will definitely be unique for CritterWatch is its support for development time assistance, and this has been a major area of focus for 0.8.0.
- The Event Modeling viewer. A swim-lane visualization of your declared
EventModelDefinition.Slicesagainst the merged runtime manifest — with drift detection (green/yellow/orange status pills) and a live causation overlay that pulls traces from your OpenTelemetry backend. The replay animation walks you through the actual sequence at ~600ms per step. The first time a junior engineer is staring at a confused-looking aggregate, you'll wish you'd had this years ago. - The Projection Stepper. Pick a projection, pick a source slice (stream slice or DCB tag query), and step through events one at a time — Play / Pause / Jump-to-N / Scrubber controls included. Monaco JSON diff between consecutive steps (lazy-loaded past 100 KB so it doesn't choke on large aggregates). 1000-event tuned perf budget. This is the tool you want when "I think the projection is computing the wrong thing" lands in your team channel.
- Source code drill-in. Click a handler chain, click a projection, click an HTTP endpoint — get back the generated Wolverine source code that's actually running. Generated source is the actual compiled pipeline; reading it tells you exactly what middleware fires, in what order, around your handler body. It's the same lazy-fetch wire pair that drives the projection viewer.
- Aspire-first. Three-line orchestration: Postgres + RabbitMQ + the CritterWatch project, all the connection strings flow automatically, you get a unified dashboard with logs and traces interleaved. The
BffHostships scenario-parameterized launch profiles so you can boot just the slice you need (full, tenancy, …). - Hot, embedded SPA. The console NuGet packs the Vue frontend (
-p:EmbedFrontend=true); the published artifact is one host that serves itself, no Node toolchain on the deploy box.
The pattern across all of these: the same telemetry the production console reads is also what powers the dev-time tools. You're not buying two products — you're getting one set of capabilities that's useful at every step of the lifecycle.
3. For AI agents — CritterWatch.Mcp, the cross-application MCP control surface
This is the piece that's hardest to describe in two paragraphs and impossible to ignore once you've seen it.
CritterWatch.Mcp is a separate optional NuGet that mounts a Model Context Protocol server on the BFF at /api/mcp — streamable HTTP transport, stateless mode, full RBAC + license gating. The console you already use to monitor your services is also an MCP endpoint that any MCP-capable agent (Claude, a custom LLM client, a tool-using CLI) can connect to. One endpoint. All your services. Every projection, every alert, every DLQ.
The catalog is 12 read tools + 21 action tools across 10 families:
| Family | Tools | Purpose |
|---|---|---|
AlertTools | list_active_alerts, get_alert, summarize_active_alerts | Cross-service alert inventory |
HealthTools | summarize_cluster_health, get_service_health, list_degraded_surfaces | Cluster-wide health snapshot |
PerformanceTools | get_backlog_state, list_backlog_hotspots, get_projection_lag | Hotspot detection |
TraceTools | query_recent_traces, get_trace, check_trace_provider_health | OpenTelemetry integration |
DlqActionTools | replay_dead_letters, discard_dead_letters | Surgical DLQ work |
ProjectionActionTools | pause_projection, restart_projection, rebuild_projection | Per-tenant projection control |
TenantActionTools | 5 tools (add, enable, disable, remove, hard_delete) | Dynamic tenant lifecycle |
AlertActionTools | acknowledge_alert, snooze_alert, clear_alert | Alert disposition |
ChaosMonkeyActionTools | 5 tools | Failure injection from an agent |
ListenerActionTools | pause_listener, restart_listener, drain_listener | Listener control |
A worked example of what this enables: an SRE notices a tail-latency uptick during an incident, opens a chat with their preferred LLM, and asks:
"Are any CritterWatch services currently above their throughput baseline by more than 30%? For each, what's the slowest handler in the last hour, and is there an open DLQ that correlates?"
The agent calls summarize_active_alerts, get_service_health per affected service, list_backlog_hotspots for the top services, query_recent_traces to find the slow spans. It reads — across every monitored service, gated by the SRE's RBAC role and the deployment's license — and gives them a summary they'd have spent twenty minutes assembling by hand.
If their RBAC role permits action tools, they can follow up with:
"Replay the three dead-letter messages on TripService whose error class is
TransientDbExceptionand originated in the last 30 minutes. Don't replay anything else."
The agent calls replay_dead_letters(serviceName: "TripService", messageIds: [...]) — and McpAuthorizationContext.EnforceAsync verifies the SRE has dlq.replay scoped to TripService (and not, say, dlq.discard). If the principal doesn't have the permission, the tool returns a structured deny envelope instead of acting. The action lands on TripService exactly the same way the SPA's DLQ replay button does — fans out through DlqOperationHandler → service-side message store → handler re-execution.
We think this story is the most important thing in 0.8.0. Distributed-systems operations is a knowledge-intensive activity that involves reading a lot of state across a lot of surfaces and making decisions; MCP gives you a way to put an LLM in the loop without abandoning the safety and audit-ability of a real RBAC + license model. CritterWatch.Mcp is not "an AI feature bolted onto a dashboard" — it's a first-class operator surface that happens to also work from a SPA.
If you don't want it, you don't pull the package. Existing CritterWatch deployments are unaffected.
Getting Started
Three flavors below. All three share the same console-side setup; only the monitored-app side changes.
Stand up the CritterWatch console
A single-node host. Pick your transport in configureWolverine — the rest is identical to the broker route.
// CritterWatchHost/Program.cs
using CritterWatch.Services.Hosting;
using JasperFx.Core;
using Wolverine.RabbitMQ;       // or .AmazonSqs / .AzureServiceBus
using Wolverine.Http.Transport; // for the broker-less HTTP route below

var builder = WebApplication.CreateBuilder(args);

builder.AddCritterWatch(
    postgresConnectionString:
        builder.Configuration.GetConnectionString("critterwatch")!,
    configureWolverine: opts =>
    {
        opts.UseRabbitMq(new Uri(builder.Configuration.GetConnectionString("rabbitmq")!))
            .DisableDeadLetterQueueing()
            .AutoProvision();

        opts.ListenToRabbitQueue("critterwatch").Sequential();
    },
    enableClusterPartitioning: false);   // turn on cluster mode in 2+ node deployments

var app = builder.Build();
app.UseCritterWatch();           // maps Wolverine endpoints, the /api/messages SignalR hub, serves the SPA
await app.RunAsync();
For a clustered deployment (2+ BFF nodes), leave enableClusterPartitioning at its true default, supply configureClusterShardedTopology, and add a redis connection string in configuration — the BFF will auto-wire AddStackExchangeRedis() on the SignalR builder for cross-node fan-out.
Optional: mount the MCP server. Single line, after AddCritterWatch:
builder.Services.AddCritterWatchMcp();        // stateless HTTP transport mounted at /api/mcp
// ... after build:
app.UseCritterWatch();
app.MapCritterWatchMcp();
Example 1 — Monitored app over RabbitMQ
The default route. The monitored app and CritterWatch share a critterwatch queue on a RabbitMQ broker.
MyApp.csproj — package references:
<PackageReference Include="WolverineFx" Version="6.4.1" />
<PackageReference Include="WolverineFx.RabbitMQ" Version="6.4.1" />
<PackageReference Include="Wolverine.CritterWatch" Version="0.8.0" />Program.cs:
using JasperFx.Core;
using Wolverine.CritterWatch;
using Wolverine.RabbitMQ;

var builder = Host.CreateApplicationBuilder(args);

builder.Services.AddWolverine(opts =>
{
    // The identity CritterWatch uses for partitioning, RBAC scoping, and the dashboard.
    opts.ServiceName = "TripService";

    opts.UseRabbitMq(new Uri(builder.Configuration.GetConnectionString("rabbitmq")!))
        .DisableDeadLetterQueueing()
        .AutoProvision();

    // One line. That's it.
    opts.AddCritterWatchMonitoring(
        critterWatchUri:  "rabbitmq://queue/critterwatch".ToUri(),
        systemControlUri: "rabbitmq://queue/tripservice_control".ToUri());

    // ... the rest of your Wolverine config (handlers, listeners, etc.)
});

await builder.Build().RunAsync();
Key points: critterWatchUri is the same on every monitored app (the BFF listens on it); systemControlUri is unique per service — CritterWatch uses it to send control commands (rebuild a projection, replay a DLQ, drain a listener) back to this app specifically. DisableDeadLetterQueueing() keeps RabbitMQ from creating DLQ queues for CritterWatch's own traffic.
Example 2 — Monitored app over AWS SQS
Same shape, different transport. SQS is the natural choice when you're already running on AWS and don't want to operate a broker. CritterWatch was built with SQS's 256 KiB message limit in mind — the lazy-fetch wire pairs and ISerializable-on-ServiceUpdates work that landed in 0.8.0 makes the BFF resilient to large topologies that would otherwise blow the cap.
MyApp.csproj:
<PackageReference Include="WolverineFx" Version="6.4.1" />
<PackageReference Include="WolverineFx.AmazonSqs" Version="6.4.1" />
<PackageReference Include="Wolverine.CritterWatch" Version="0.8.0" />Program.cs:
using JasperFx.Core;
using Wolverine.AmazonSqs;
using Wolverine.CritterWatch;

var builder = Host.CreateApplicationBuilder(args);

builder.Services.AddWolverine(opts =>
{
    opts.ServiceName = "TripService";

    // AWS credentials picked up from the standard SDK provider chain (env vars,
    // EC2 instance profile, EKS service account, etc.).
    opts.UseAmazonSqsTransport()
        .AutoProvision();

    opts.AddCritterWatchMonitoring(
        critterWatchUri:  "sqs://critterwatch".ToUri(),
        systemControlUri: "sqs://tripservice_control".ToUri());
});

await builder.Build().RunAsync();
For local development against LocalStack, swap the transport line for UseAmazonSqsTransportLocally(port: 4566) — the rest is identical. The Trip3 sample family in the CritterWatch repo demonstrates the full LocalStack-in-Aspire story end-to-end.
The console-side change is minimal — add WolverineFx.AmazonSqs to your CritterWatchHost and switch to (or add alongside) UseAmazonSqsTransport() + ListenToSqsQueue("critterwatch"). The BFF can listen on RabbitMQ + SQS + Azure Service Bus at the same time, so you don't have to pick — different services on different transports flow into the same console.
Example 3 — Monitored app over Wolverine HTTP transport (no broker)
This is the example that surprises people. CritterWatch can talk to monitored apps directly over HTTP, with no broker between them — useful for HTTP-only services that don't run any asynchronous messaging of their own, or for environments where standing up a broker just to give CritterWatch a channel is operationally awkward (small fleets, regulated environments where monitoring traffic should ride the same secured ingress as application traffic, …).
The shape: the monitored app exposes Wolverine's HTTP transport endpoints (POST /_wolverine/invoke and POST /_wolverine/batch/{queue}); CritterWatch publishes to that URL using ToHttpEndpoint(...). Request/reply rides the HTTP response slot — no listener on the CritterWatch side, no return channel to configure.
MyApp.csproj:
<PackageReference Include="WolverineFx" Version="6.4.1" />
<PackageReference Include="WolverineFx.Http" Version="6.4.1" />
<PackageReference Include="Wolverine.CritterWatch" Version="0.8.0" />
Program.cs (the monitored side — say, a Wolverine.Http service):
using JasperFx.Core;
using Wolverine.CritterWatch;
using Wolverine.Http;
using Wolverine.Http.Transport;     // <- the HTTP transport endpoints

var builder = WebApplication.CreateBuilder(args);

builder.Host.UseWolverine(opts =>
{
    opts.ServiceName = "BillingApi";

    // No broker. CritterWatch reaches us over our own HTTP ingress.
    opts.AddCritterWatchMonitoring(
        critterWatchUri:  null,   // no broker queue
        systemControlUri: null);  // control comes back over the HTTP transport
});

var app = builder.Build();

// Your normal Wolverine.Http endpoints.
app.MapWolverineEndpoints();

// THIS is the line that exposes the broker-less transport:
//   POST /_wolverine/invoke           — request/reply (CritterWatch -> us)
//   POST /_wolverine/batch/{queue}    — batched fire-and-forget
app.MapWolverineHttpTransportEndpoints();

await app.RunAsync();
Console-side configuration — point CritterWatch at the monitored app's /_wolverine/invoke:
// In the CritterWatchHost's configureWolverine
opts.PublishAllMessages()
    .ToHttpEndpoint("https://billing-api.internal/_wolverine/invoke");
That's the whole setup. InvokeAsync<TResponse> then reads the reply straight off the HTTP response body — no ListenAtUrl(...).UseForReplies(), no ReplyListener, no correlation table. Latency is one round trip instead of two; failure modes are HTTP status codes; the operational surface is "one HTTPS endpoint per service."
This route is the right answer when:
- The service already exposes HTTP and adding a broker is overkill.
- The traffic is request/reply shaped — control commands and queries dominate, fire-and-forget telemetry is incidental.
- You want monitoring traffic to ride the same secured ingress as the application traffic for compliance reasons.
It's not the right answer when:
- You need store-and-forward semantics across a CritterWatch outage (broker route buffers; HTTP route fails fast).
- You're broadcasting telemetry to multiple consumers — broker fan-out is free; HTTP is point-to-point.
- The monitored app already publishes durable messages over a broker — attaching CritterWatch to the same broker is the cheapest path.
The two routes aren't mutually exclusive, either — a service can publish telemetry to a broker and accept control commands over HTTP. Wolverine routes each message type by its configured destination, not by transport.
Where to go next
- Docs: Installation for the canonical install walk-through; Clustering for the HA story; Transport Channels for HTTP/gRPC; MCP Integration for the MCP server reference; RBAC Guide for the capability catalog and authorizer wiring.
- Skill (AI-agent setup): the
wolverine-integrations-critterwatch-setupskill in the JasperFx AI Skills library walks through the whole setup in agent-friendly form. - Samples in the repo:
Trip1*(RabbitMQ),Trip2*(Azure Service Bus),Trip3*(AWS SQS + LocalStack),MTTrip*(multi-tenant),PolecatTrips(Polecat-backed event store) — each is a small, runnable demonstration of the matching transport / tenancy story.
A note on the road to 1.0
0.8.0 is the largest dot-release we've cut, but CritterWatch is still pre-1.0 — by design. The things landing between 0.8.0 and 1.0 are the things that justify a 1.0 stamp: stabilizing the public API surface for Wolverine.CritterWatch, full Polecat parity in the event-store views, an LDAP / OIDC RBAC recipe library, a packaged Helm chart, and a couple of operator-comfort affordances we're still iterating on.
The packages on NuGet today are:
| Package | What it is |
|---|---|
CritterWatch | The console BFF, with the embedded Vue 3 SPA |
Wolverine.CritterWatch | Monitored-side observer (MIT-licensed; shippable in any production app) |
Wolverine.CritterWatch.Http | The HTTP transport channel for the broker-less story above |
CritterWatch.Mcp | Cross-application MCP server |
Marten.Mcp / Polecat.Mcp / WolverineFx.Mcp | Per-package MCP servers — single-application introspection, distinct from CritterWatch.Mcp's cross-app surface |
All seven are tagged with the same 0.8.0 version and published from the same v0.8.0 tag on main.
Acknowledgements
CritterWatch builds on the work of the entire JasperFx team and the Critter Stack community. Special thanks to the operators who've been running 0.7.0 in real deployments and feeding back the warts that 0.8.0 fixes — particularly the large-topology SQS payload story (#261) that drove the wire-format hardening, and the multi-tenant operators whose feedback on tenant lifecycle drove Phase 3.
Try it out: dotnet add package CritterWatch --version 0.8.0.
Find us at https://github.com/JasperFx/ProductSupport or in the "CritterWatch" channel on the Critter Stack Discord server.