
CritterWatch 1.1 beta 4 is out, and the feature I've personally wanted the longest is finally in it: you can now run the console inside your own application instead of standing it up as a separate thing.
Update, September 25: use 1.1.0-beta.5 for embedded mode
Client feedback caught a bad one within a day of this post. Embedded in a real application, the beta 4 console served its page at /critterwatch and then wouldn't navigate anywhere. Every screen is loaded on demand, and the browser was asking for those screens' files at your application's root instead of under /critterwatch, so it got a 404 and stopped. The console logo and some icons were broken the same way.
1.1.0-beta.5 fixes it, so if you're trying embedded mode, upgrade to beta 5. Nothing else about the setup below changes. It also keeps routing if your application has a Content-Security-Policy that blocks inline scripts. And the embedded console now gets opened and clicked through in a real browser, against the packed NuGet packages, before every release. That's the test that would have caught this in the first place.
When we shipped CritterWatch 1.0 back in August, the story was "a separate console that watches your fleet." That's definitely going to be the right solution for a lot of teams — if you've got a dozen services on RabbitMQ or Azure Service Bus, you want one place to look, and you want it isolated from the failures it's there to catch. We'd always planned on getting back to an embedded model as well, and that became important for a JasperFx customer who has a very different set of needs than we'd anticipated (weird how that happens!). Anyway, let's say you say I've got one Wolverine app on one Postgres database. I don't want another deployment, I don't want a broker, I just want to see what my projections are doing.
Fair enough! Embedded mode is the answer to that. Here's what it is, here's how you turn it on, and the inevitable catches.
What's new in CritterWatch 1.1
Embedded mode is the headline for this post, but 1.1 is a big release and it's worth the shape of it before I zoom in. The short version:
- Run the console inside your own application — the rest of this post.
- Projections at fleet scale. The Operations screen was designed against a test fleet of two databases; a production console with 512 databases and 11,637 shards met it very differently. Shard progression is queried server-side now, the 42–63 second browser stalls are gone, and the health signals that were quietly sampling one shard out of 512 aren't any more.
- The Event Model is a live screen — commands, events, projections and the handlers between them, rendered from the running code rather than drawn by hand. Pair it with the Projection Stepper to watch a projection evolve event by event.
- Schedule a rebuild for tonight, and recurring cron schedules you can see and pause from the console.
- Stream compaction on a schedule, for the streams that never stop growing.
- Query the event store in SQL — one read-only
SELECT, allow-listed to the store's own tables, every run audited. The escape hatch for the join orGROUP BYthe filters can't express. - AI and MCP — all 66 tools now emit portable input schemas (OpenAI strict, Gemini and MCP Inspector all happy), and there's opt-in alert triage by a language model that writes a short assessment beside a batch of alerts.
- Every screen says how old it is. A console that stopped receiving telemetry now says so instead of looking calm — the failure mode I most wanted gone.
- RBAC on every operator command in the console, not just over MCP.
The full 1.1 release notes have all of it, including the upgrade notes you'll want if you wired real permissions or lean on the SQL view.
What "embedded" actually means
The CritterWatch console mounts inside your application as additional ASP.Net Core endpoints:
- The console's UI is served under
/critterwatch(configurable). Your own routes are untouched — a route that 404s today still 404s, because the mount is a guest, not a takeover. - The console gets its own store, isolated from yours by construction. CritterWatch needs string stream identity where your application almost certainly uses
Guid, and that's a per-store setting, so it was never going to share yours. It lives in its own schema (critterwatchby default) in the same PostgreSQL, SQL Server, or even Sqlite database. - The console monitors the host it lives in. There's no separate service to instrument. Telemetry travels in-process, over Wolverine's
local://messaging, and the host shows up in the console as a monitored service with its projections, listeners, dead letters and message stores.
It's a registration mode on the packages that already exist — CritterWatch for Marten/PostgreSQL, CritterWatch.SqlServer for Polecat, CritterWatch.Sqlite for Fisher. No new package, no new project.
Turning it on
We're going to remove the need for the runtime compilation before the official 1.1 release
You need WolverineFx.RuntimeCompilation in your host (more on why below), and then it's two lines:
using CritterWatch.Services;
using CritterWatch.Services.Hosting;
using Npgsql;

var postgresSource = NpgsqlDataSource.Create(connectionString);

builder.Host.UseWolverine(opts =>
{
    // ... your own Wolverine configuration ...

    // On PostgreSQL/Marten this takes an NpgsqlDataSource.
    // The Polecat (SQL Server) and Fisher (SQLite) overloads take a connection string.
    opts.AddCritterWatchEmbedded(postgresSource, schemaName: "critterwatch");
});

var app = builder.Build();

// Mounts the console's UI under /critterwatch. Your own routes are untouched.
app.UseCritterWatchEmbedded();
One small thing that cost a reader a compile error before we caught it: the Marten overload takes an NpgsqlDataSource, while the Polecat and Fisher overloads take a plain connection string. And the two calls live in different namespaces — CritterWatch.Services for the registration, CritterWatch.Services.Hosting for the mount. Now you know.
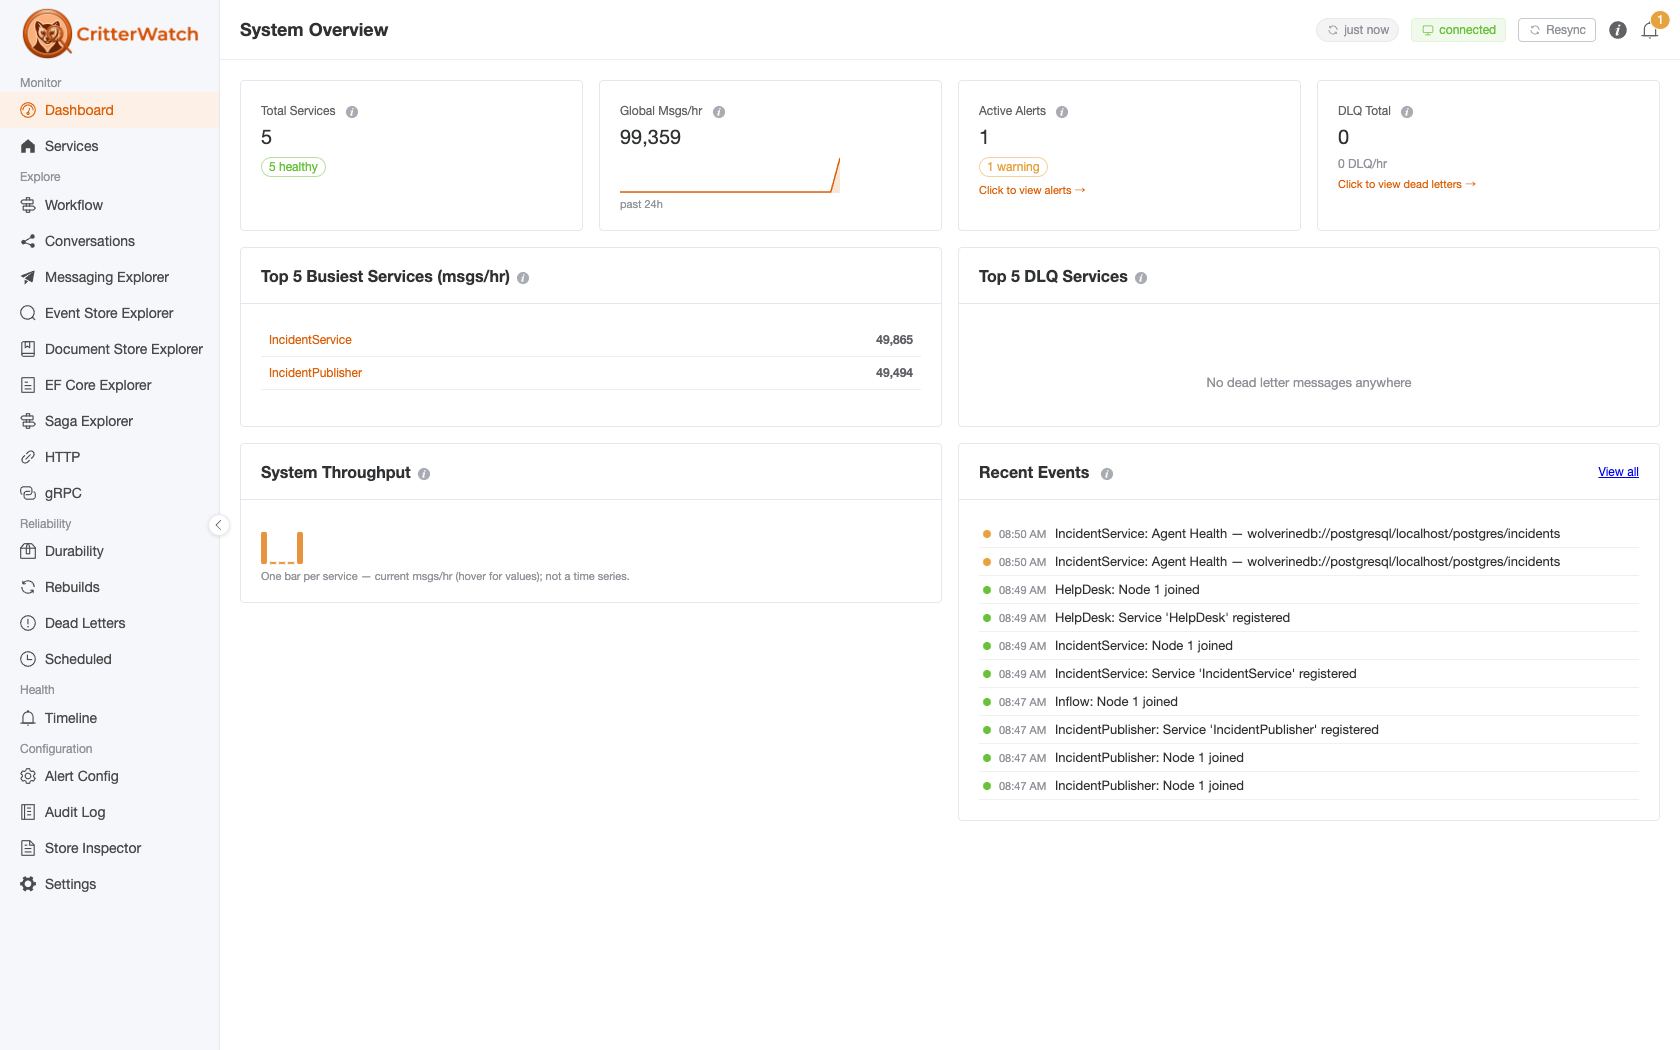
Start the app, browse to /critterwatch, and you're looking at your own application's projections, dead letters, and alerts. The MCP server rides along too, so an AI agent can ask the same questions you'd ask the screen.
No broker at all: PostgreSQL queues
Here's the part I'm most pleased about. An embedded console never needed a broker for itself — it talks to its host in-process. But if your application's own messaging is on RabbitMQ, you've still got a broker in the deployment, and the "one database, one process" story isn't quite true.
Wolverine has had database-backed queues on PostgreSQL for a while now. Put those together with embedded CritterWatch and you get an application that needs exactly one piece of infrastructure — the Postgres it already runs — for its documents, its events, its message durability, its queues, and its monitoring console:
builder.Host.UseWolverine(opts =>
{
    // Wolverine's database-backed queues, in the same PostgreSQL you already run.
    //
    // role: MessageStoreRole.Ancillary is REQUIRED. Without it the transport registers itself
    // as a second "Main" message store, collides with your own Marten IntegrateWithWolverine
    // store, and the application fails to start. See below.
    opts.UsePostgresqlPersistenceAndTransport(
            connectionString,
            transportSchema: "myapp_queues",
            role: MessageStoreRole.Ancillary)
        .AutoProvision();

    opts.AddCritterWatchEmbedded(postgresSource, schemaName: "critterwatch");
});
That's the whole configuration. We've got this exact combination — embedded console, Marten store, PostgreSQL queues, no RabbitMQ anywhere — under an integration test that boots a real host and asserts the host actually shows up as a monitored service. (Not just that the API answers. An empty fleet renders as a calm, healthy, completely blank screen, and I've learned the hard way that "it returned 200" proves nothing.)
The two things that will bite you
To be perfectly honest, I hit both of these myself while writing that test, so this section is me saving you an evening.
1. That role: MessageStoreRole.Ancillary flag is not optional. Leave it off and the app refuses to start:
InvalidWolverineStorageConfigurationException: There must be exactly one message store tagged as
the 'main' store, you may need to mark all but one message store as 'ancillary'. Found multiples: ...
A database-backed transport otherwise registers itself as a second Main message store, which collides with the one your IntegrateWithWolverine() call already set up. Ancillary tells Wolverine "this is my transport, not my node store," and everybody gets along. The error message is at least honest about what it wants.
2. Your host must not handle CritterWatch's own message types. If your application declares a handler for, say, ServiceUpdates, the host refuses to start and names the conflict. That refusal is deliberate on our part. Under Wolverine's default multiple-handler behavior a direct handler silently shadows CritterWatch's batching handler for that message — and that batching handler is the entire reason the console can ingest telemetry from a big fleet at all. Shadow it and ingest quietly collapses from a hundred-plus messages a second to about fifteen a minute, with nothing in the log. A startup error you can read is strictly better than that, so we promote the warning to a failure.
You're unlikely to trip this one on purpose — it takes handling a message type that belongs to the monitoring tool — but the dynamic assembly scan that makes embedded mode work is exactly the thing that would find such a handler, so it's worth knowing.
Limitations, stated plainly
- Single instance only. Embedded self-monitoring rides in-process messaging, which can't cross nodes. Run two nodes of your app with an embedded console in each and you've got two consoles writing the same streams. CritterWatch detects this at runtime and tells you; the fix is the standalone console, which is what clustering is for.
- It watches its host and nothing else. An embedded console does not ingest telemetry from other services. If you want one place to see a fleet, that's the standalone console.
- You need
WolverineFx.RuntimeCompilation. The standalone console ships with pre-generated static handler registries, and those skip the assembly scan that finds your handlers. Embedded has to generate the console's chains at runtime alongside yours. - Your host owns the runtime. The console shares your application's Wolverine node and message store. If you need the console isolated from your application's failures, run it standalone.
None of these are surprises if you think about what "embedded" means, but I'd rather say them out loud than have you discover them at 2 AM.
What it costs, and how to get it
CritterWatch has a free tier: the read-only console, which is genuinely useful on its own for seeing what your projections and listeners are doing. A commercial license unlocks the parts that do things — dead letter replay, projection rebuilds, listener and node control, alerting, audit logs, the entire MCP server. Embedded mode itself is part of the packages, so it's available on both.
Tiers and current pricing are on the CritterWatch plans section of our products page, with a buy link on each. And if you're already weighing a support contract, do the arithmetic the other way around: every JasperFX support plan offers CritterWatch as an add-on, and the Premium plan includes it outright, along with consulting hours and a private channel to the people who wrote the framework. For a lot of teams that bundle is better value than a license alone.
If you'd rather try before you buy, ask us for a trial license on the Get in Touch page.
Where to go next
- The docs — Embedded CritterWatch covers everything above plus the schema and durability details, and the 1.1 release notes cover everything else in this release (there's a lot — the fleet-scale work alone is a post of its own).
- A complete worked example — the Embedded.Sqlite sample is one ASP.NET Core app with the console embedded in it and no infrastructure at all. Swap Fisher for Marten and you've got the PostgreSQL version.
- Report a bug or ask for something — JasperFx/ProductSupport is the public tracker for CritterWatch.
- Come talk to us — the #CritterWatch room in the Critter Stack Discord is the fastest way to get a question in front of the people who built it.
And if you just want to talk it through first — Get in Touch. Happy to set you up with a trial license.