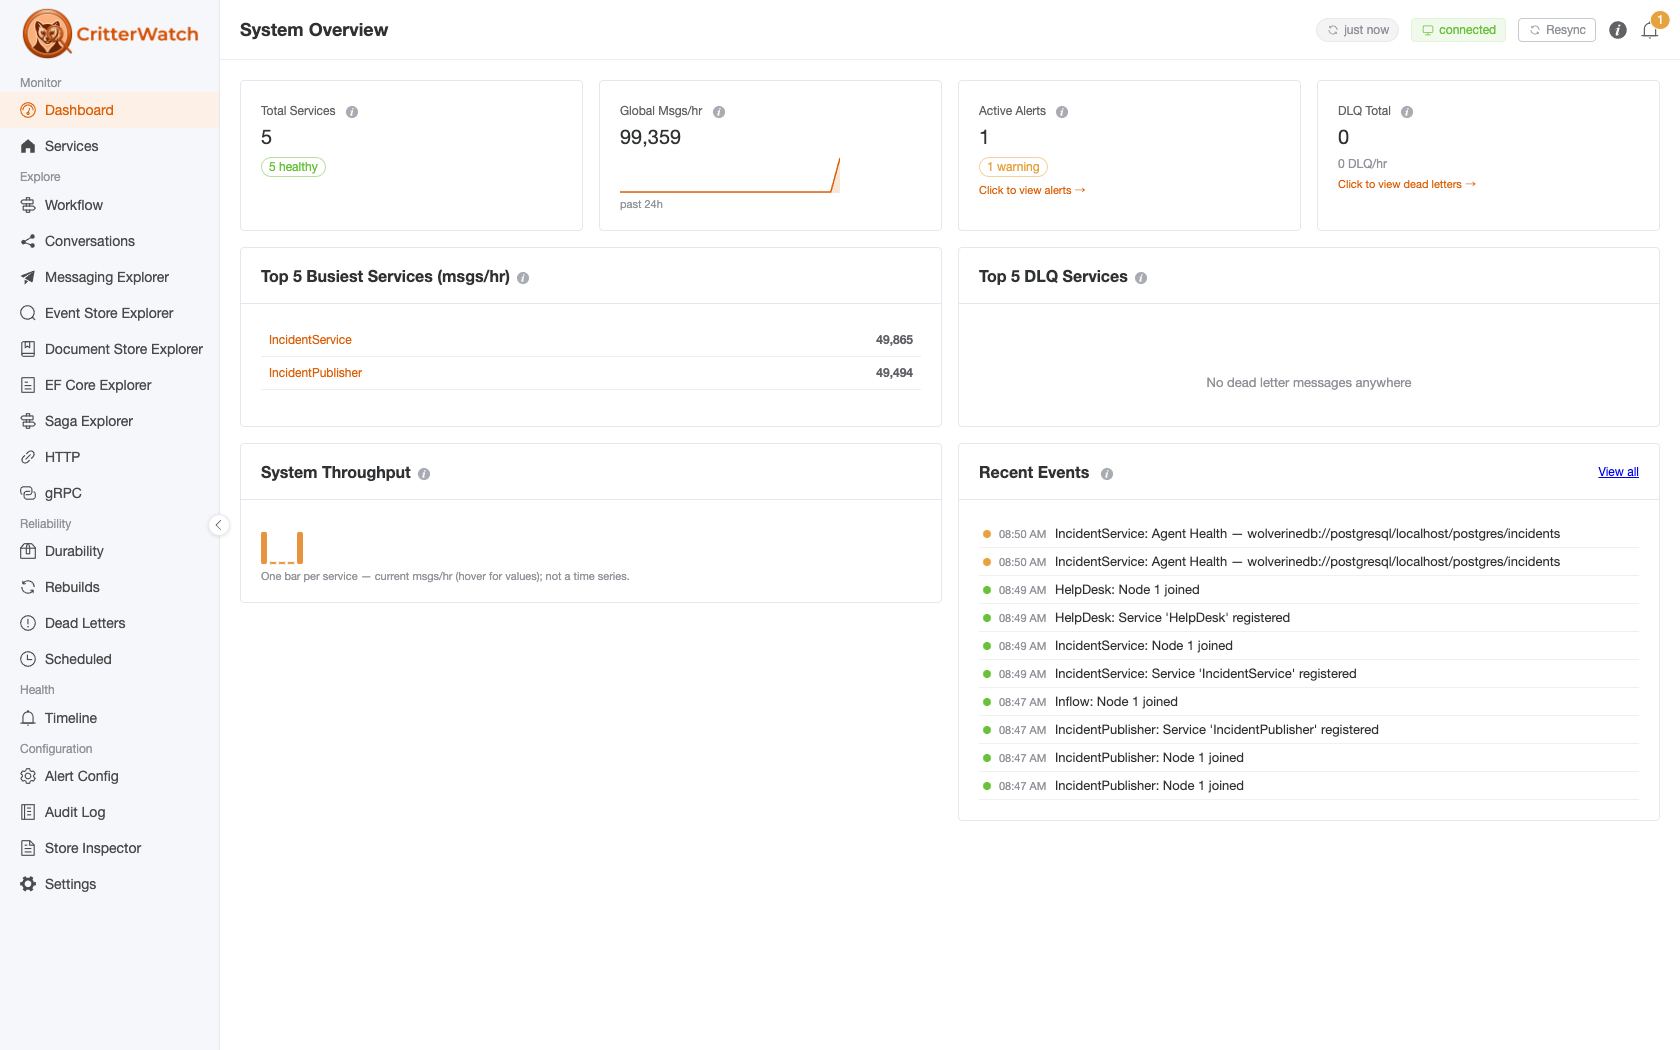

CritterWatch is a monitoring and production management console for Wolverine, Marten and Polecat applications. While it can act as a replacement for metrics-focused APM tools like Prometheus in low-volume usage, you'll probably want to have CritterWatch work with any of your existing APM tools — Prometheus, VictoriaMetrics, or AppInsights for performance metrics, and Jaeger or AppInsights for OpenTelemetry tracing. CritterWatch knows how to collate your Critter Stack application internals to the metrics and spans that get published for intelligent consumption of that data. And that performance data especially is valuable because CritterWatch uses that and other events published by the Critter Stack tools to perform alerting across all your monitored systems.
We'll happily add support for additional APM tools as folks request them, but we've naturally supported the tools our early adopters happened to be using
Let's stop and think about some of the conditions that throw your normally well-behaved systems into chaos:
- A customer unexpectedly uploads a massive flat file of import data to your system that's far larger than you ever expected (it happens)
- An external web service your system depends on goes down, or just starts behaving very poorly
- Kubernetes does Kubernetes things and application nodes are popping up and down without warning
- Your database administrators do an unexpected outage at 2AM by killing the database server without warning (you're probably thinking to yourself, that sounds awfully specific...)
- Somebody starts running an expensive report against your database server
- Your asynchronous projections hit unexpected data and start throwing exceptions
CritterWatch can help you spot some of that through admittedly second-order effects like a sudden surge in traffic over what you expect, application nodes being started or torn down, Wolverine circuit breakers tripping off or opening back up, event projections getting behind, back pressure causing Wolverine to stop or restart listeners, or a high level of messages landing in dead letter queues.
This post covers three surfaces of the 1.0 release: the complete alert catalog, the Timeline that visualizes alerts and other application cluster events, and what an AI agent can do against a console over MCP.
Part 1 — a little bit about the alerting subsystem
Not surprisingly for a company and community heavily invested in Event Sourcing, CritterWatch's alert subsystem is itself event sourced and every alert is an event stream.
AlertRaised → AlertElevated / AlertReduced → AlertResolved. Immutable events, so an incident has a history, not just a current state. This is a Critter Stack product; of course alerting is event-sourced. The payoff is that you can ask what an incident actually did over its lifetime, not just whether it is red now. An alert that went Warning → Critical → Warning tells you that story, because AlertElevated and AlertReduced are real events on the stream. AlertAcknowledged and AlertCleared are operator actions on the same stream.
The stream identity is composed once, in one place: alert:{service}:{alertType}:{subject}. The alert type is an enum (AlertId.Types) rather than a string constant, because a one-character typo in a stream key produces an alert that raises forever and resolves never.
Most clear themselves
When the condition goes away, the alert resolves on its own — with the reason recorded. No stale red badges to dismiss by hand.
That is the general rule, and the exceptions below are called out explicitly where they exist.
Projections — falling behind
Three genuinely different failures that all look like "the projection is behind" from the outside.
ProjectionLag is the honest one. The shard is running, but it cannot keep up: it is N events behind the high-water mark and the gap is not closing. Warning at 1,000 events behind, Critical at 10,000. It escalates and de-escalates — a shard that starts catching up gets its alert reduced, then resolved when it is level. It also declines to fire, and resolves anything standing, for a shard that is legitimately rebuilding, and for a shard whose high-water sequence is unknown rather than zero.
ProjectionStale is more worrying. The shard has simply stopped advancing — no error, no pause, the sequence number is just not moving. Warning at 5 minutes without progress, Critical at 30 minutes. There is a five-minute startup grace so that a service restart does not page anybody. An opt-in AutoRestartOnStale (default off) will send a restart for the shard when the Critical threshold is crossed.
ProjectionDeadLetters is the one worth dwelling on. Events are failing to apply and being quarantined. Under the JasperFx.Events SkipApplyErrors default the shard keeps advancing — so nothing crashes, no dashboard goes red, and your read model is quietly missing data. Warning at 1 dead-lettered event, Critical at 10. One bad event is enough.
Its resolve behavior is deliberately asymmetric, and it is the one place in this family where "most clear themselves" needs qualifying. The Warning is a recency signal: it raises on a strict increase in the shard's dead-letter count, not on the count being non-zero, and after a resolve it will re-raise at most once an hour. It clears when the dead-letter rows are replayed or cleared and the count falls back below the warning floor — not merely when things go quiet. A standing backlog at or above the Critical threshold escalates immediately, independent of that throttle. And a null dead-letter count — a store that does not measure them — is treated as a non-measurement, so it neither raises nor resolves.
Projections — not running at all
Not "slow". Absent. Gone. Kaput. I know, that should never happen and there's plenty of Polly and other resiliency in the projection subsystems as is, but things still go wrong and we want you to have defense in depth.
ProjectionPaused — a shard is paused and staying paused. There are two evaluators behind this one alert type and they do not agree on severity, deliberately:
- The 30-second sweep splits on who paused it. A pause whose reason begins with
"Paused by operator"is expected state and raises Warning; every other pause — a daemon error-pause,SkipApplyErrorsexhaustion — raises Critical. A deliberate operator pause should not page anyone at 3am. It auto-resolves when the shard stops describing itself as paused. - The push evaluator, which handles a
ProjectionPausedReportcascaded off the telemetry feed, is always Critical. That is not an inconsistency: the daemon only reports a pause on the halting path. A skipping policy dead-letters the poison event and the shard keeps running, so it never pauses and this evaluator never hears about it. Every report that arrives there is the Critical case by construction. Its re-raise gate opens when the failure description changes — a shard reporting the same pause on every restart attempt raises once, not once per attempt — and it has no self-resolve path, because a paused shard has no "recovered" report to send. Resolution comes from an operator skipping, rewinding or rebuilding it.
AgentDown — the agent that runs this shard has stopped sending heartbeats. Nothing, on any node, is running this projection. 60 seconds of silence → Critical.
Two caveats worth having in prose. First, that 60-second window is hardcoded — it is the one threshold in this section that is not operator-configurable. If you want it tunable today, you cannot have it. Second, a paused shard is not an outage and CritterWatch does not treat it as one: AgentDown explicitly stands down when the shard describes itself as paused, resolving anything standing and short-circuiting, so you get one accurate alert instead of two contradictory ones. It stands down the same way for an orphaned shard — a projection retired or version-bumped — where a stale heartbeat is the expected steady state and will be forever.
HighWaterStale is the subtle one. The high-water mark itself has frozen, which means every lag figure on the screen is measured against a stopped clock. Warning at 5 minutes, Critical at 30 minutes. Without this alert, a dead high-water agent makes every projection look perfectly caught up, because the thing they are measured against stopped too — the projections page lies. That is the whole reason it exists.
HighWaterAgentRestarted — Warning. The mark went backwards between polls, or the agent reported an explicit Restarted action. The first observation only baselines the sequence, so a leader failover does not replay the mark as a reset, and the tracker is keyed per (service, store, tenant, database) because a tenant-partitioned store draws a separate sequence per tenant and comparing across them scores every descending pair as a restart.
The sweep also resolves alerts for shards that have stopped existing — retired or version-bumped projections get "Shard no longer present" as the resolution reason rather than a permanently-critical row nobody can clear.
Cluster & agents
As a fun exercise, pre-1.0 releases of CritterWatch were dogfooded in cooperation with a JasperFx customer against the highest-volume Critter Stack system we're aware of. That one single system involved over 500 different databases and over 10,000 agents for Wolverine to assign every time Kubernetes did Kubernetes things. We introduced these alerts and made a lot of improvements to the robustness of Wolverine's agent assignment subsystem as a result. Gulp.
Two alerts, and they catch the same class of incident: the cluster is busy rearranging itself instead of doing your work. Neither is visible in a per-service health check. Each individual node is fine; the cluster is thrashing.
AgentReassignmentStorm — Warning. One agent keeps being handed from node to node: the grid is re-issuing assignments in a loop, and the agent spends its life starting up instead of working. Fires at more than 6 reassignments for one agent URI in a 5-minute sliding window. In steady state an agent is assigned once and stays put.
NodeFlapping — Critical. A node keeps being ejected and coming back. More than 3 ejections of the same node number in the same 5-minute window. It is Critical where the reassignment storm is only a Warning because a flapping node causes reassignment storms — it is the upstream cause. Every ejection triggers a reassignment sweep, so one flapping node destabilizes the whole cluster.
⚠️ These two resolve differently from the rest, and it is worth being precise rather than generous. The sliding windows are node-local in-memory counters on the console — they count telemetry that is never appended as events, so there is nothing to derive them from — and the resolve fires when the next churn signal arrives below threshold, not on a timer. If churn stops dead, no further signal arrives, and nothing resolves the alert. Do not read "5-minute window" as "auto-resolves after five minutes"; it does not.
Transport & listeners
These alerts are about your runtime usage of messaging technologies like RabbitMQ or Azure Service Bus or AWS SQS or Kafka.
TransportUnhealthy (Critical) and TransportDegraded (Warning) are the broker connection being down and being impaired-but-functioning respectively. Both are relayed, not computed: transport health is the transport's own verdict, and CritterWatch does not second-guess it. Each has its own alert stream, so a transport going Degraded → Unhealthy raises the Critical instead of finding a shared latch already taken. When the transport reports Healthy again, whichever of the two is actually active resolves.
StaleListener (Warning) is the interesting one, and it catches the worst failure mode in a message-driven system: a listener that reports "Accepting" and is consuming nothing. Every health check says green. The process is up. The connection object exists. The endpoint says it is accepting. And nothing is being consumed.
The gate is that only a listener claiming to be fine can be silently stuck — Direction is Listening and Status is Accepting. A paused or drained listener is an operator decision and is never alerted on. Given that, a listener counts as stuck when any of these is true:
- its transport channel is Disconnected
- its receive loop is Stopped or Faulted
- 2+ minutes of silence with messages waiting in the broker
- 2+ minutes of silence with messages in its local queue
The first two are direct signals and fire immediately — the listener demonstrably cannot consume, so there is no reason to wait for a backlog to build. The last two are the fallback for transports that do not report connection or receive-loop state, and the depth > 0 requirement is what stops a legitimately idle queue from alerting. Reconnecting is a transient recovery state, not a fault, and does not trip the alert.
Opt-in auto-kickstart will send a RestartListener for a stuck listener. It is off by default — automatic remediation you did not ask for is not a feature — and rate-limited to one attempt per endpoint per 10 minutes, so a genuinely broken listener is not hammered on every evaluation pass. A recovery clears the throttle, so a fresh stuck episode kickstarts immediately. The alert resolves on "Listener activity resumed", which includes the case where the listener stopped reading Accepting because an operator paused it.
When the endpoint protects itself
CritterWatch computes neither of these. They are Wolverine's own protective mechanisms firing inside your service — the console is what makes them visible, and what records that they happened. Wolverine already had both; what it did not have was anywhere for you to find out.
The canonical example here is placing a circuit breaker on a messaging endpoint where handlers are calling out to an external web service, and the circuit breaker will stop the listener temporarily if there's a higher than allowed rate of errors
CircuitBreaker — Critical. Wolverine's own circuit breaker on an endpoint tripped: the failure rate crossed the threshold you configured, and it stopped delivering to protect the downstream. The alert message carries the failure-percentage threshold and pause time the breaker was configured with, so you are not going back to source to find out what it was protecting against. It resolves when the breaker resets — on the reset message from the service, not on a re-poll.
Both halves gate on the persisted alert record rather than an in-process latch, which matters in two directions: a console restart no longer re-raises every already-active breaker alert, and a reset arriving after a restart is no longer silently dropped against an empty dictionary, leaving the alert active forever.
"Back Pressure" here means that Wolverine is temporarily -- hopefully temporarily! -- stopping a message listener because there are too many unhandled messages already in memory. This is a way to protect your system from out of memory problems under unexpected loads
BackPressure — Warning, escalating to Critical if it has not lifted within one minute. A listening endpoint's buffered queue passed its maximum, so Wolverine latched the listener: it stopped pulling messages off the transport because the handlers cannot keep up.
This is worth explaining concretely because people mix it up with broker depth. It is the local in-memory buffer on a listening endpoint. The handlers are slower than the intake, the buffer hits its ceiling, and Wolverine stops pulling. It resumes on its own when the queue drains below the restart limit. The escalation is the useful behavior: brief back pressure under a spike is normal and self-correcting, and back pressure that is still on a minute later is a capacity problem — the severity says so. It resolves on the lifted message from the service, which also cancels a pending escalation.
Metrics thresholds
| Alert | What actually went wrong | Fires at |
|---|---|---|
MetricsExecTime | Handlers got slower than this service's normal for this hour of this day. | +50% over baseline → Warning, +200% → Critical |
MetricsThroughput | Traffic is far above normal — a retry storm, a replay, a runaway publisher. | 3x baseline → Warning, 10x → Critical |
MetricsFailureRate | Handlers are failing, as a share of everything attempted. | 5% → Warning, 20% → Critical, over a 30-minute window |
MetricsDlqRate | Messages are landing in the dead-letter queue at a sustained rate. | 10/hr → Warning, 50/hr → Critical |
The organizing idea is the relative/absolute split. "Slower than normal" and "busier than normal" only mean something against a baseline; the first two are relative. "5% of your messages are failing" and "50 dead letters an hour" mean something on their own; the last two are absolute.
All four require the condition to hold for two consecutive passes before they raise — and two calm passes before they resolve. At the 30-second cadence that is about a minute of confirmation before any state change reaches you. Monitoring that pages you for a single sample is monitoring people turn off. Both counts are configurable per service.
Two things to be honest about.
⚠️ The throughput check is high-side only. The comparison is multiplier >= criticalMult, then multiplier >= warningMult, then nothing — so a throughput collapse produces a multiplier below one and raises nothing at all. If you are asking "does this catch a service going quiet?", the answer for this alert is no. ProjectionStale and StaleListener cover the quiet cases.
These are evaluated per service and per tenant — not per message type. The thresholds model carries per-message-type overrides, but this evaluator does not consult them today.
One detail on the dead-letter rate that is worth knowing, because it changes the number you see: the canonical figure is net-new rows in the service's actual dead-letter tables over the trailing hour, not a counter. The RecordDeadLetter metric counter produced phantom thousands-per-hour readings over empty tables in the field, so it is only consulted when there is no table ground truth for the service at all — external-TSDB-only monitoring, for instance. The number you are alerted on is the number you would get by counting, and it is the same snapshot the dashboard widget and the services table read, so the three agree by construction.
What "above baseline" actually means
"50% above baseline" is meaningless until you know where the baseline came from, and the answer is more interesting than people expect. There are three branches, in this order:
- Observed history, if it is mature. Per hour-of-day and day-of-week, so "normal for 3am Sunday" is a different number from "normal for 10am Tuesday". Mature means 100+ sample buckets AND 10+ days of history — and, for throughput, an observed baseline above a floor of 1 msg/hr. The maturity gate is the important part. Without it, a service CritterWatch first saw thirty seconds ago would alert "throughput is 24x above normal" against a baseline of zero, which is exactly the false page that makes people distrust a tool on day one.
- A declared baseline, if one is set. This is the fallback for a service too new or too quiet to have earned an observed one.
- No alert at all. With neither, that dimension does not alert — and any standing alert is force-resolved rather than left measured against a baseline that has gone away.
The alert message says which one it used: the source is interpolated into the text, so you read "is 4.2x observed baseline" or "is 4.2x declared baseline" and know immediately whether to trust the number.
You declare a baseline on the monitored service, through the configureBaselines callback on AddCritterWatchMonitoring:
opts.AddCritterWatchMonitoring(
    critterWatchUri,
    systemControlUri,
    configureBaselines: baselines =>
    {
        baselines.ForService(throughputPerHour: 5_000, avgExecTimeMs: 40);
        baselines.For<ProcessPayment>(throughputPerHour: 800, avgExecTimeMs: 120);
    });
Service-level declarations apply to any message type without its own, and both dimensions are independently optional. The registry is forwarded to the console on first contact and is editable from the CritterWatch UI afterwards.
⚠️ The published alert-configuration docs currently describe this cascade backwards, and name a
WolverineCritterWatch.DeclareBaseline(...)API that does not exist. The cascade above is what the code actually does.
And the console watches itself
SelfIngestFailure — Critical. One alert type, three subjects:
telemetry-ingest— the console is receiving your data and failing to write it.ingest-listener— the console's own listener is no longer receiving, and telemetry is piling up on the broker.cluster-configuration— the console's cluster shape does not match what was declared.
A monitoring tool that goes blind quietly is worse than no monitoring tool. Everything CritterWatch shows you is only as good as its ability to ingest what your services are sending; if that breaks and says nothing, every dashboard silently freezes at its last good value and looks perfectly healthy.
All three surface as a banner in the SPA as well as an alert, and the status push is re-sent every poll tick while degraded, so a browser that connects mid-incident still learns about it. The nice detail: the alert append to the store is best-effort and wrapped in a try/catch, precisely because the store is very often the thing that is failing. The banner and the health mark are the surfaces that are not allowed to depend on it.
Tuning
Thresholds cascade: shard → service → global default.
| Dimension | Warning | Critical |
|---|---|---|
| Projection lag | 1,000 | 10,000 events |
| Projection stale | 5 min | 30 min |
| Projection dead letters | 1 | 10 events |
| Execution time | +50% | +200% |
| Throughput | 3x | 10x |
| Failure rate | 5% | 20% |
| Dead-letter rate | 10/hr | 50/hr |
Those are the shipped defaults, all of them yours to change. The cascade is the real feature: a noisy integration queue and your payments queue should not share a threshold, and per-shard and per-service overrides exist for exactly that. A shard override can also suppress a shard outright.
All of it is editable under Settings › Alert Configuration, with a live Preview that evaluates your unsaved thresholds against the most recent metrics — so you can tune a Critical threshold without burning a real alert to find out whether you got it right. A History tab audits every threshold change: what changed, when, and by whom.
Getting alerts off the console and into where people actually are is two lines and a token:
opts.AddCritterWatchSlack(slack =>
{
    // A Slack Bot OAuth token with chat:write scope (required).
    slack.BotToken = Environment.GetEnvironmentVariable("SLACK_BOT_TOKEN")!;

    // Where alert notifications land by default.
    slack.DefaultChannel = "#critterwatch-alerts";

    // Critical-severity alerts can route to a dedicated channel.
    slack.CriticalChannel = "#ops-critical";
});
A warning channel people skim and a critical channel people are paged from should not be the same channel. CritterWatch.Slack is its own package. Alerts are also on the SignalR feed and the HTTP API, so anything that can read those can forward them.
The nineteen, in one table
| Alert type | Family | Severity | Auto-resolves? |
|---|---|---|---|
ProjectionLag | Projections — behind | Warning / Critical | Yes, escalates and de-escalates |
ProjectionStale | Projections — behind | Warning / Critical | Yes |
ProjectionDeadLetters | Projections — behind | Warning / Critical | Only when the rows are cleared or replayed |
ProjectionPaused | Projections — absent | Warning (operator) / Critical | Sweep: yes. Push evaluator: no |
AgentDown | Projections — absent | Critical | Yes; stands down for paused and orphaned shards |
HighWaterStale | Projections — absent | Warning / Critical | Yes |
HighWaterAgentRestarted | Projections — absent | Warning | Yes |
AgentReassignmentStorm | Cluster & agents | Warning | On the next below-threshold signal, not on a timer |
NodeFlapping | Cluster & agents | Critical | On the next below-threshold signal, not on a timer |
TransportUnhealthy | Transport & listeners | Critical | Yes, on the transport's own Healthy report |
TransportDegraded | Transport & listeners | Warning | Yes, on the transport's own Healthy report |
StaleListener | Transport & listeners | Warning | Yes |
CircuitBreaker | Endpoint self-protection | Critical | Yes, on the breaker's reset message |
BackPressure | Endpoint self-protection | Warning → Critical after 1 min | Yes, on the lifted message |
MetricsExecTime | Metrics | Warning / Critical | Yes, after two calm passes |
MetricsThroughput | Metrics | Warning / Critical | Yes, after two calm passes. High-side only |
MetricsFailureRate | Metrics | Warning / Critical | Yes, after two calm passes |
MetricsDlqRate | Metrics | Warning / Critical | Yes, after two calm passes |
SelfIngestFailure | The console itself | Critical | Yes, on a fully quiet recovery window |
Part 2 — the Timeline
An alert tells you something is wrong right now. The next question is always the same: what else happened around then? That is the Timeline.
It is called Timeline — sidebar, under Health; route /timeline; keyboard shortcut g t. (The docs still call it the "Activity Timeline" in places; in the product it is just the Timeline.)
What it is
A live, reverse-chronological feed of notable fleet events, across every monitored service, in one place. Not metrics, not traces — events with operator meaning:
- Service — registered, version detected, capabilities changed
- Node — added, removed, dormant node ejected, and a synthesized
NodeFlappingsummary - Agent — started, stopped, leadership assumed, leadership lost
- Projection — rebuild started and completed, paused or restarted by an operator, subscription rewound, projection ejected, apply error, dead letter recorded, and the daemon's own auto-recovery restart
- Listener — paused, resumed, drained by an operator
- Alert — raised, elevated, resolved, cleared
- Tenant — added, enabled, disabled, removed
Each entry carries a service name, a category, an event type, a severity (info / warning / critical), a title, a description, an optional subject URI (an agent URI, an endpoint URI, a projection shard), a timestamp, and a metadata dictionary.
The question it answers that nothing else does
Every other page in the console is a current-state view: the projections page shows where shards are now, the nodes page shows who is up now, the alerts page shows what is red now. None of them answers "what was the sequence?"
The Timeline is the only surface that puts a node ejection, the agent reassignments it triggered, the projection that consequently stalled, and the alert that fired about it on one ordered list. That ordering is the diagnosis. A stalled projection with no context is a mystery; a stalled projection forty seconds after the node running it was ejected is an answer.
How it works
It is an event projection over the console's own event store — TimelineProjection writes TimelineEntry documents inline with the event append. A post-commit session listener then publishes each newly committed entry to the SPA over SignalR, best-effort, in a way that can never fail the committing session. So the console does not poll for its own timeline; entries arrive as they are written.
On open you get the hundred most recent entries via GET /api/critterwatch/timeline, newest first, with a pulsing Live badge while the SignalR connection is up and a Disconnected badge when it is not. The client holds a rolling five hundred.
Filtering, and the noise problem it had to solve
Service scope comes from the global header's service picker rather than a page control, and a scope chip shows what is active. On the page itself: a severity selector, multi-select category chips, and free text across title, description, service and event type.
The interesting filter is a checkbox labeled Agent & node lifecycle, and it is off by default. On a real fleet, agent-start and node-join/leave entries were 99.8% of all rows — one reporting fleet produced 145,000 AgentStarted and 116,000 node join/leave entries in fifty hours against roughly 120 alert rows. Left visible, they bury everything an operator actually opened the page for. They are one click away when you want them, and the synthesized NodeFlapping summaries are deliberately exempt so a genuinely flapping node is never hidden by the toggle that exists because of flapping nodes.
Three kinds of client-side coalescing do the rest: identical consecutive events within 60 seconds collapse to ×N; alert raise/resolve alternations within five minutes collapse to flapping ×N; and a per-tenant alert fan-out for one rule within five minutes collapses to a single card with an N tenants tag — three hundred tenants, one card.
Its relationship to alerts
Alerts are the Timeline's most important consumer, and the integration goes both ways. The dashboard bell links straight to /timeline, and deep links carry filters — /timeline?severity=critical,warning scrolls the first match into view and pulses it.
More usefully, an alert card on the Timeline is actionable. If the alert is still live, the card offers Acknowledge and Snooze (1h) inline, license-gated. It also offers remediation actions from the alert store — navigate to the relevant projection, or confirm-and-send a RestartProjection / RestartListener over SignalR. ProjectionPaused and CircuitBreaker alerts render a structured exception panel — type, message, syntax-highlighted stack — instead of prose. Resolved history stays action-free, as it should.
It is not the Conversations view, and it is not the Audit Log
Two things share vocabulary with the Timeline and are worth separating.
Conversations answers a different question: not "what happened on the fleet around 14:32" but "what did this one message cause". It renders one causal graph for a root message across every service it touched — a Why view of what caused what, and a When view that is a Gantt of the waits between hops. It needs no tracing backend; it is captured first-hand from Wolverine's own ActivitySource inside each monitored service. Different data, different store, different page. The Timeline is fleet-wide and time-ordered; Conversations is message-scoped and causally ordered.
The Audit Log is a separate page (/audit-log, under Configuration), a separate document type, and a separate license-gated endpoint. It records every operator action that mutated a monitored service — timestamp, action, service, target, expandable parameters, and who did it — in a table with filtering and paging. There is real overlap in coverage, because an operator pausing a projection produces both a Timeline entry and an audit entry, but neither is a filtered view of the other. They are independent writes to independent stores, not one filtered view of the other.
Retention
Timeline entries are retained 30 days by default, configurable under CritterWatch:Timeline, and TimeSpan.Zero opts out of age-out entirely. An hourly sweep runs as a cluster singleton, so exactly one node in a multi-node console issues deletes, and it does four passes rather than one:
- Age-out — entries older than the retention period, deleted by id in batches of 500 and capped per sweep so a large backlog is worked down rather than issued as one enormous statement.
- Compaction — runs of consecutive identical
AgentStartedentries collapse. This is the pass that actually reclaimed the motivating case: a 59-agent service holding 671,000 rows over ten days, nearly all of them redundant re-reports sitting comfortably inside any sane age window. - Node-flap coalescing — six or more strictly alternating
NodeAdded/NodeRemovedentries with gaps of 90 seconds or less collapse into oneNodeFlappingsummary, with the first and last preserved as anchors. - An opt-in per-service row cap, off by default.
A fifteen-minute compaction grace period keeps the sweep from racing entries an operator is currently watching arrive.
⚠️ Three corrections if you have already read the docs for this page. There is no CSV export for the Timeline or the Audit Log — the only CSV export in CritterWatch is on the Dead Letters page. Timeline data is no longer retained indefinitely; the retention sweep above shipped in 1.0. And there is no
AuditLogRetentionDayssetting — audit entries have no pruner at all today. Where the docs and this post disagree, this post describes the shipped behavior.
Part 3 — what is exposed over MCP
Everything an operator can do in the console has a machine-facing twin. Same commands, same license gate, same RBAC checks, same audit trail — reachable by an AI agent over the Model Context Protocol.
The server is mounted on the console at /api/mcp, over streamable HTTP, not stdio — pick the matching setting in your client. It runs stateless by design, and that is load-bearing rather than incidental: in the default stateful mode the HttpContext an authorization check would read is the one that initialized the session, not the one making the current tool call, so the caller's identity would be stale for every action after the first.
Forty-eight tools across sixteen families. Twenty-one read, twenty-seven act.
Read and diagnose
Alerts — list_active_alerts (filter by service and severity), get_alert (one alert by its stream id), summarize_active_alerts (per-service, per-severity counts; the "what's wrong right now?" tool to reach for before drilling in).
Health — summarize_cluster_health (services, total/online/stale nodes, per-broker and per-endpoint status totals), get_service_health (one service in detail: running nodes, agent assignments, per-endpoint direction/status/queue depth, dead-letter persistence counts), and list_degraded_surfaces, which returns exactly the endpoints and brokers whose status is anything other than Healthy.
Performance — get_backlog_state (inbox / outbox / scheduled / dead-letter counts per service and message store), list_backlog_hotspots (everything over a threshold you supply — "where is the work piling up?"), and get_projection_lag (per-shard sequence, last advance, agent status, any error).
Traces — query_recent_traces filters recent OpenTelemetry traces by Wolverine's own semantic tags (message.type, saga.id, tenant, handler, listener, destination), get_trace pulls the full span set for one trace, and check_trace_provider_health exists so that "no traces found" can be distinguished from "the backend is down" without guessing.
Routing — get_message_routing and list_message_routing read the cached picture: where a message type routes and which route sources and conventions contributed each destination. explain_message_routing is the live one — it asks the running service (Wolverine's ExplainRoutingFor) and returns the ordered route-source chain, including which terminating source short-circuited the rest, rendered as a stable labeled text block meant for an agent to read.
Documents — list_document_types, query_documents and get_document reach into a monitored service's document store live, over a correlated round-trip.
Lifecycle — describe_lifecycle answers "where does this message or event type fit in the workflow?" across all monitored services at once, returning both a Mermaid sequence diagram and structured JSON: publisher → handler(s) → cascaded messages → appended events → projections → read models, stitched across service boundaries, with each edge tagged by provenance (inferred from structure, observed at runtime, or both).
Dead letters — summarize_dead_letters groups counts by message type and exception type across every message database the service owns; query_dead_letters returns the individual envelopes with their ids, exception detail, attempt counts and replayability.
That last pair is a read family with a difference, and it is worth being exact about the boundary:
Read does not mean ungated
Every MCP tool is license-gated, reads included. There is no free MCP tier. That is not a side-effect of some tools being administrative — it is the deliberate design. McpLicenseGuard resolves the license once and caches the answer for the process lifetime.
On top of that, action tools go through McpAuthorizationContext.EnforceAsync, which checks the license first and only then the RBAC capability. An unlicensed caller never reaches your authorizer. Denials come back as a JSON envelope naming the error (LicenseMissing or Forbidden), the capability, and the resource.
And the exception that matters: DlqReadTools is a read family that still requires RBAC. Both tools demand the mcp.dlq.read capability, scoped to the target service. The reasoning is that dead letters carry business payloads, so "may look at them" is worth granting separately from "may act on them" — and an agent needs the read in order to discover the envelope ids the action tools require. Every other read family is license-only.
Two more things worth knowing before you wire this up. RBAC is off until you turn it on: with no custom ICritterWatchAuthorizer registered, the default authorizer allows everything, and every capability string below is inert. Register one and it becomes fail-closed — anything not explicitly granted is denied. And the license cache never expires, so a key added after the process started requires a restart.
Act
Dead letters — replay_dead_letters (dlq.replay) and discard_dead_letters (dlq.discard), both scoped to the service, both taking the ids the read tools surfaced. Both publish and return immediately; the discard has no undo.
Projections — pause_projection (projection.pause), restart_projection (projection.restart), rebuild_projection (projection.rebuild) and eject_projection (projection.eject). The first three accept an optional tenant id, which does two things: it targets the tenant-scoped shard through the per-tenant daemon API rather than the store-global one, and it narrows the authorization resource to service:tenant rather than the whole service. eject_projection is for orphans only — a progression row whose projection has been renamed, versioned or removed, which can never be paused, restarted or rebuilt because no registered projection owns it.
Listeners — pause_listener (listener.pause), restart_listener (listener.restart) and drain_listener (listener.drain). Pause stops processing immediately and buffers; drain stops accepting new envelopes but lets in-flight work finish — the one to reach for before a deploy.
Tenants — add_tenant, enable_tenant, disable_tenant, remove_tenant and hard_delete_tenant, each with its own capability. The last two are separate grants on purpose: tenant.remove deletes the master-table record and leaves the database intact for forensics, while tenant.hard-delete issues DROP DATABASE … WITH (FORCE). A grant to clean up master records should not extend to dropping databases.
Alerts — acknowledge_alert (alert.acknowledge), snooze_alert (alert.snooze) and clear_alert (alert.clear), each authorized against the alert stream id rather than the service. Acknowledgement records that someone saw it without clearing it.
Chaos monkey — eight tools, split so that turning it on and off (chaos-monkey.toggle) is a different grant from configuring what it does (chaos-monkey.configure): failure rate, artificial handler delay, projection failure rate, a deterministic projection poison targeted at one event type or one exact event, and a dead-letter seeder. That last one exists because a probabilistic failure rate is a dice roll per invocation and can produce zero dead letters indefinitely, which makes a demo or a test unreproducible.
Metrics and services — delete_metrics_samples (metrics.delete) purges persisted samples older than a cutoff, fleet-wide or scoped to one service. evict_service (service.evict) drops a registered service from monitoring — summary, alerts, metrics, timeline, agent health, per-service overrides — and stops it counting toward the licensed service cap. It is "clear until it speaks again": a service that is still running re-registers on its next update.
A worked example
Ask your agent:
"Explain why these messages failed, and replay the recoverable ones."
One sentence, and it crosses the read/action boundary. What the agent does:
summarize_dead_letters— groups the backlog by message type and exception type, so it can see what is failing and how much, rather than paging through envelopes. It checksdatabasesAnsweredagainstdatabasesAnnounced, because a partial answer means some stores did not report and the counts are a floor, not a total.query_dead_letters— pulls the individual envelopes for whichever group matters, with their exception detail and — critically — their ids and whether each can be replayed.- It explains the failure in prose. This is the part a threshold on a graph cannot do.
replay_dead_letters— with exactly the ids that came back replayable.
Steps 1 and 2 need the license and the mcp.dlq.read capability. Step 4 needs the license and dlq.replay. Both checks happen server-side, scoped to the service, and land in the same audit log a human operator's replay would. The agent triages, explains, and then acts — and the acting half hits exactly the gate a human would.
Get started
In your service:
dotnet add package Wolverine.CritterWatchThe console — pick the one matching your database:
dotnet add package CritterWatch            # PostgreSQL / Marten
dotnet add package CritterWatch.SqlServer  # SQL Server / Polecat
dotnet add package CritterWatch.Sqlite     # SQLite / Fisher
Also on NuGet: CritterWatch.Services, the store-agnostic core all three consoles pull in, and CritterWatch.Slack for the alert notifications above.
Two packages, and roughly ten lines of configuration. If you want to try it with no infrastructure at all, CritterWatch.Sqlite writes to a file.
- Docs: critterwatch.jasperfx.net
- Plans and pricing: jasperfx.net/our-products/#critterwatch-plans
- AI skills for the Critter Stack: ai-skills.jasperfx.net
Monitoring is free — every dashboard, every explorer, every drill-in. A license is required for state-changing actions and for the MCP server.