
JasperFx's goal is to make the Critter Stack the very best technical solution for server side development in .NET, and a big part of that is being able to see what your system is actually doing in production.
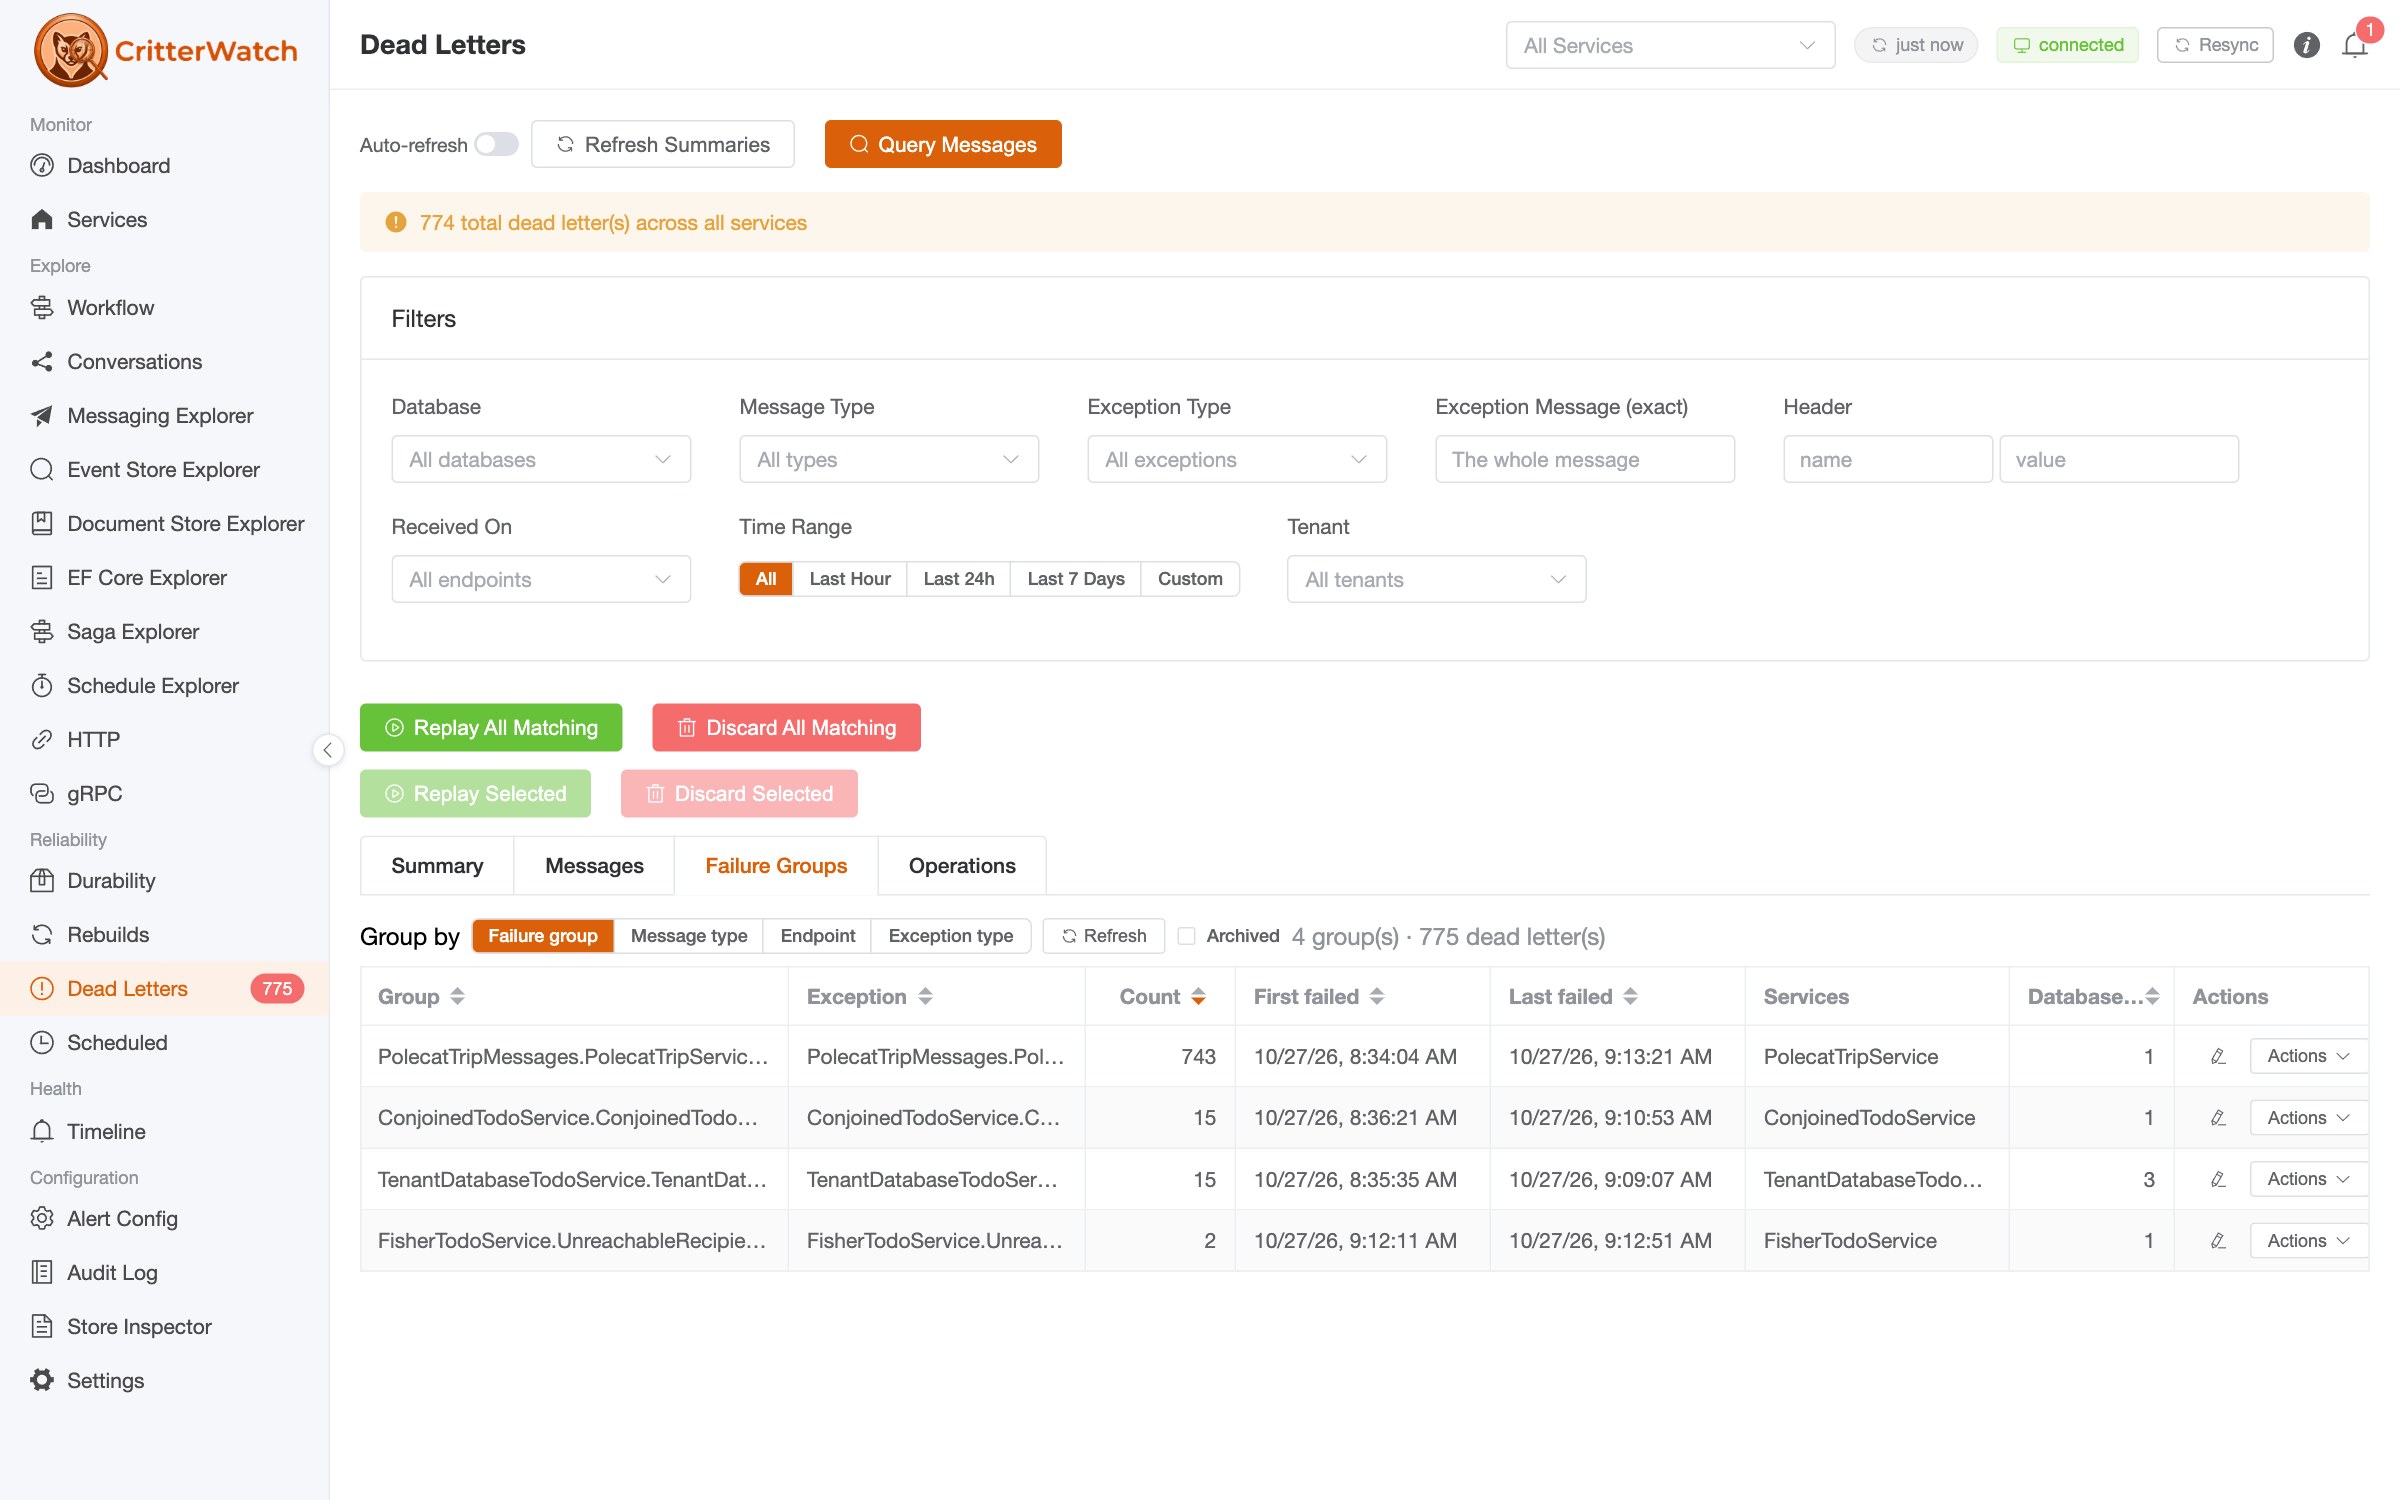
CritterWatch 1.1 was mostly about fixing bugs and improving its ability to handle one absolutely massive system for a JasperFx client, but that release also added dead letter failure groups, recurring scheduled job management, event stream compaction policies, and even more MCP tools that let an AI agent help you manage and understand your systems. 1.2 adds a lot more polish to the user interface and adds new features for looking inside the data and ongoing work within your system. If you've ever opened a SQL client against a Marten database to find out why a projection is wrong, or grepped logs to find out where a saga got stuck, this release has some features you're going to love.
We walked through every one of these screens by hand before the release, with a live fleet of sample services running Marten, Polecat (SQL Server) and Fisher (SQLite), and changed a lot of what you'll see below as a result.
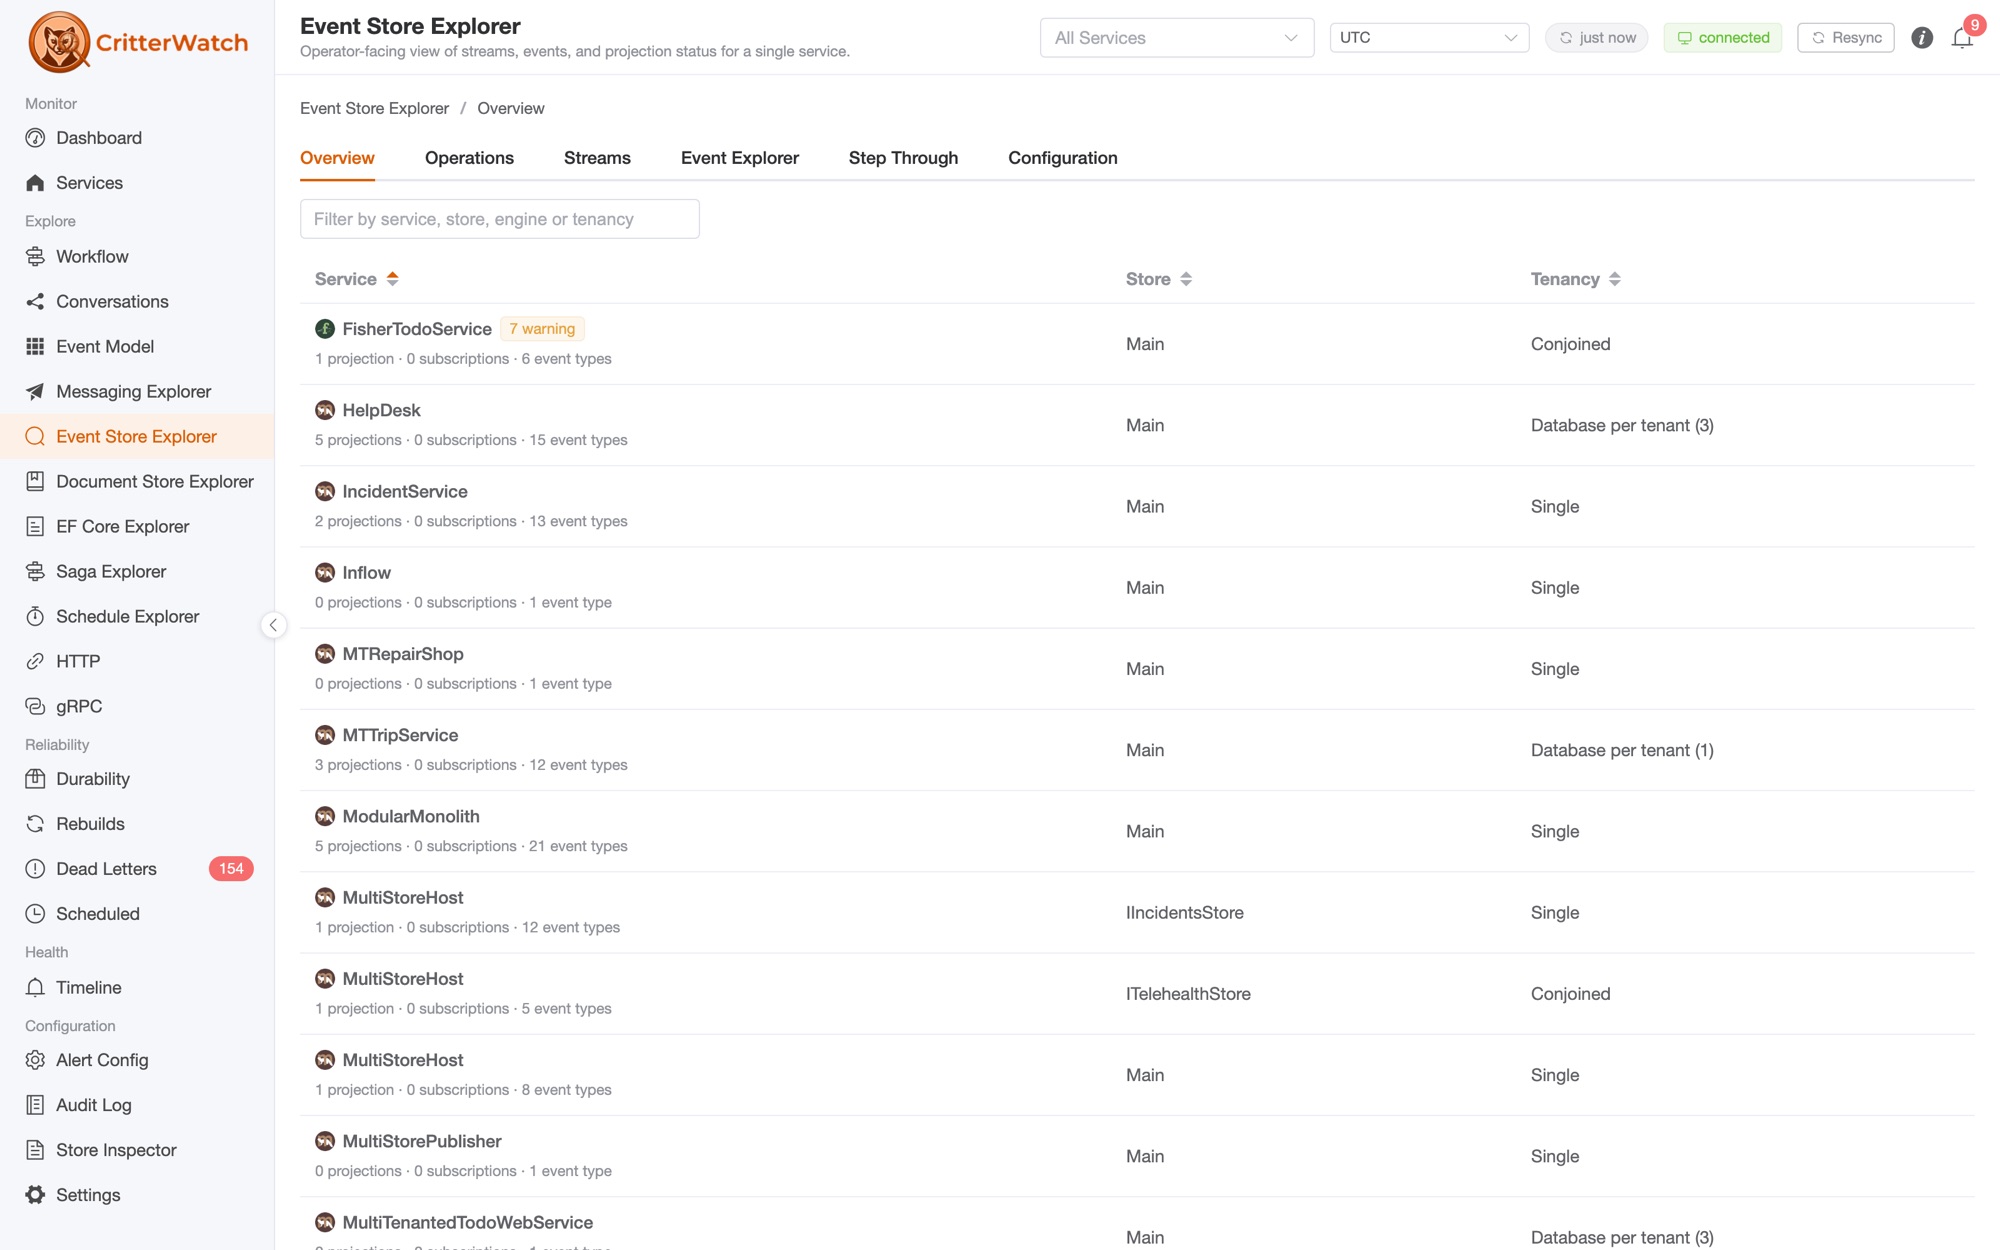
Every event store, on one screen
The Event Store Explorer now opens on an Overview of every service and every event store in your fleet: which engine it runs on, the store's name as you registered it (ancillary stores included), whether it's single tenant, conjoined or database per tenant, how many projections, subscriptions and event types it carries, and any alerts against it. Click a row and you're in that store; Back brings you right back to the table.
Inside a store, the Event Explorer now takes a WHERE and an ORDER BY over event bodies and event metadata, on all three stores. "By Filters" is now By Filters or Tags, because it queries by DCB tags too. And both the Streams tab and the Event Explorer now only query when you ask them to. That sounds small until your event store has a hundred million events in it.
See The Overview tab and querying events by their bodies.
Step through a projection, one event at a time
The Projection Stepper has been in CritterWatch for a while, and during our own review we realized it wasn't very discoverable. In 1.2 it's a Step Through tab that's always there. Pick a projection, feed it a stream, a range of a stream's versions, or a set of DCB tags, and step through it event by event: the state before and after each event, and the Apply or Evolve method that ran. The same tab can rehydrate a single aggregate at its latest version or at any version you name.
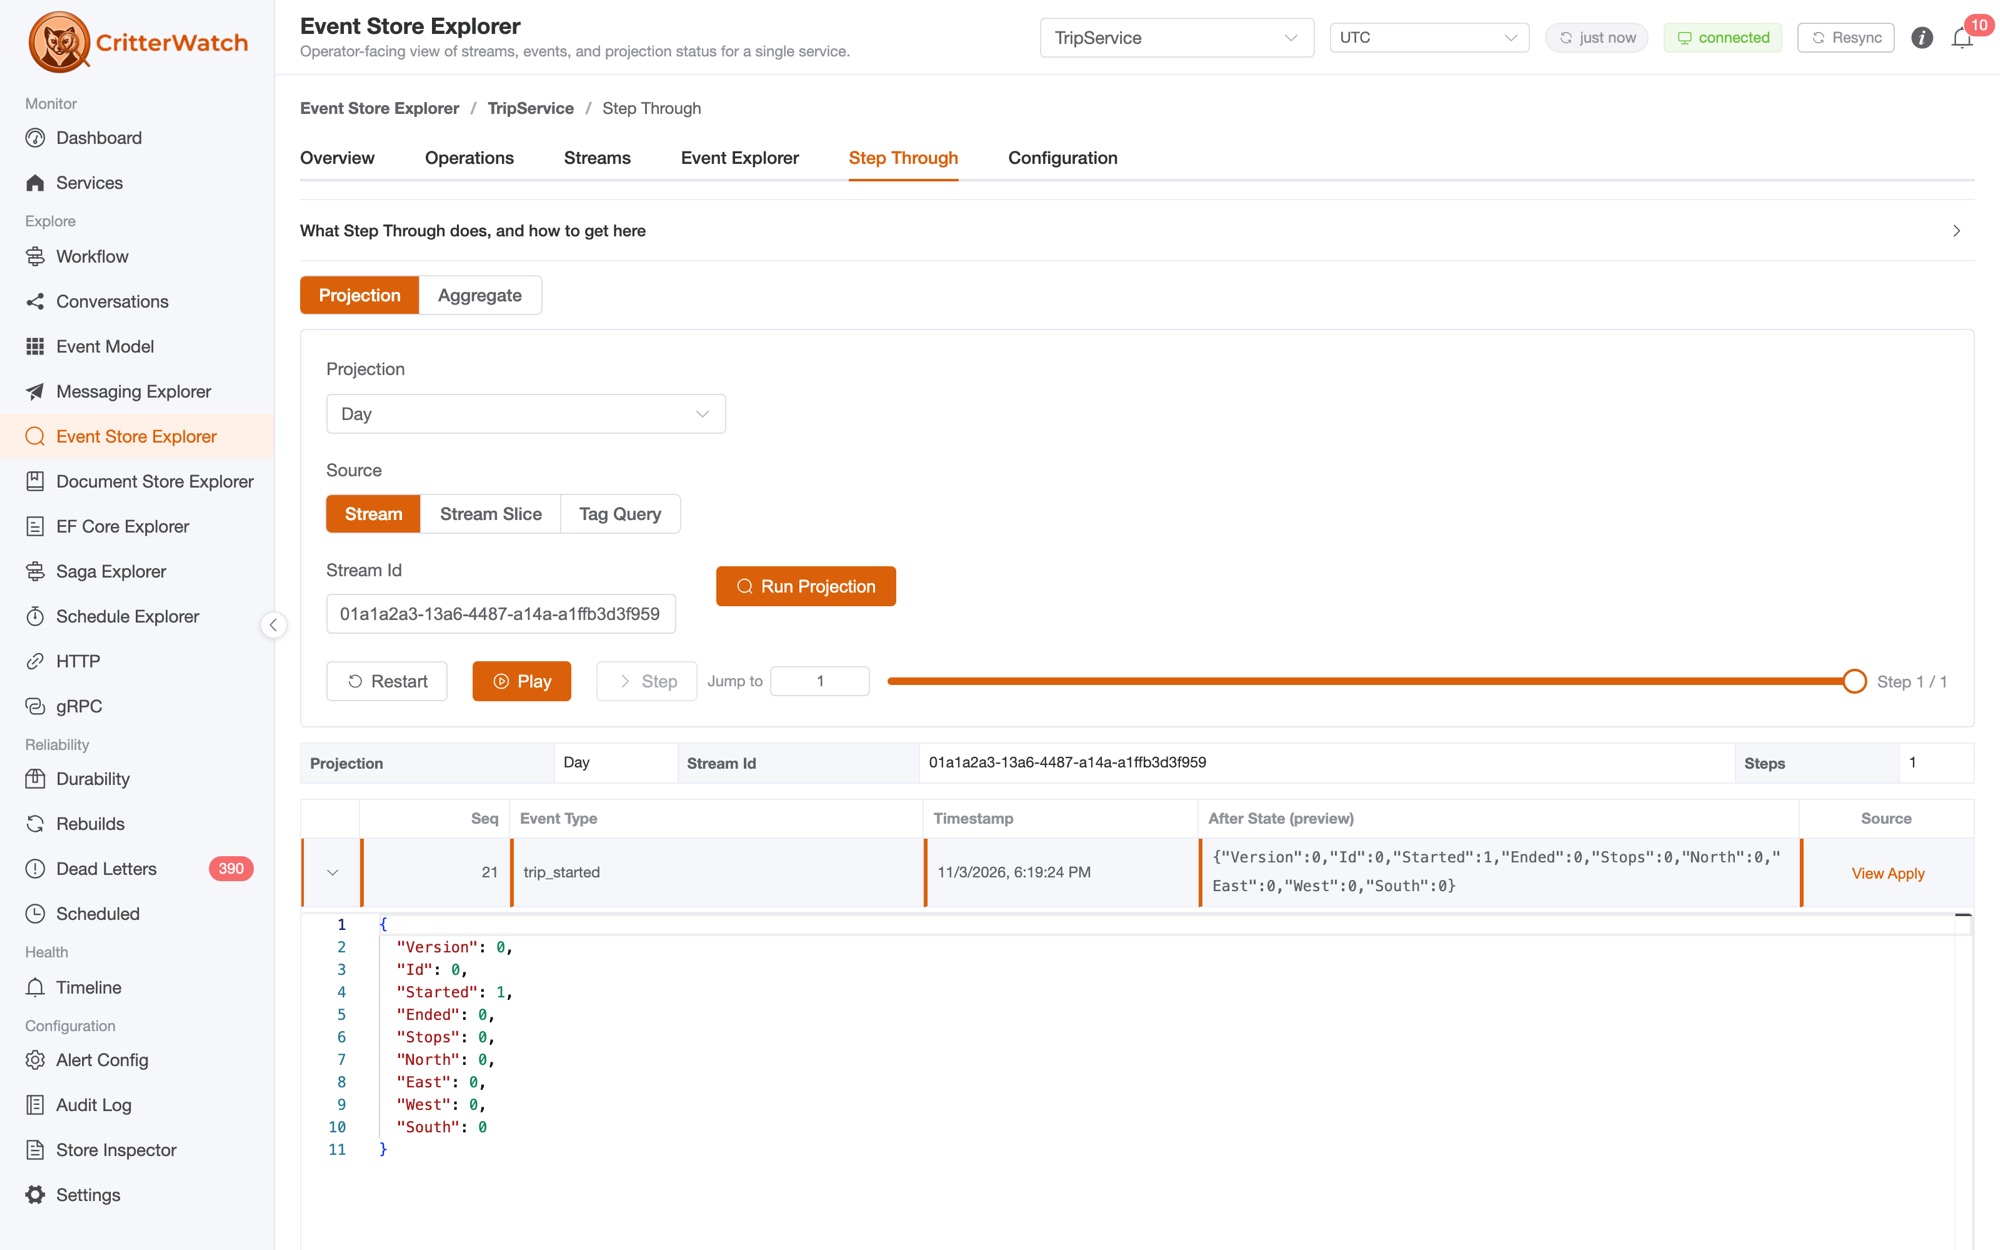
Every place in the console where "why does this projection look like that?" comes up now hands you off to it with the projection and the source already filled in: a stream's row, an Event Explorer query, a projection's row in Operations, its alerts and dead letters, and a view's card on the Event Model. Your AI agent can do the same thing over MCP with run_projection_stepper. See Step Through.
The Document Store Explorer checks your documents
The Document Store Explorer has its own Overview now too, with every service, store and document type in the fleet, and an exact row count when you ask for one. We were careful here: counting reads the table, so it never happens on its own, it can be cancelled, and every count tells you when it was taken.
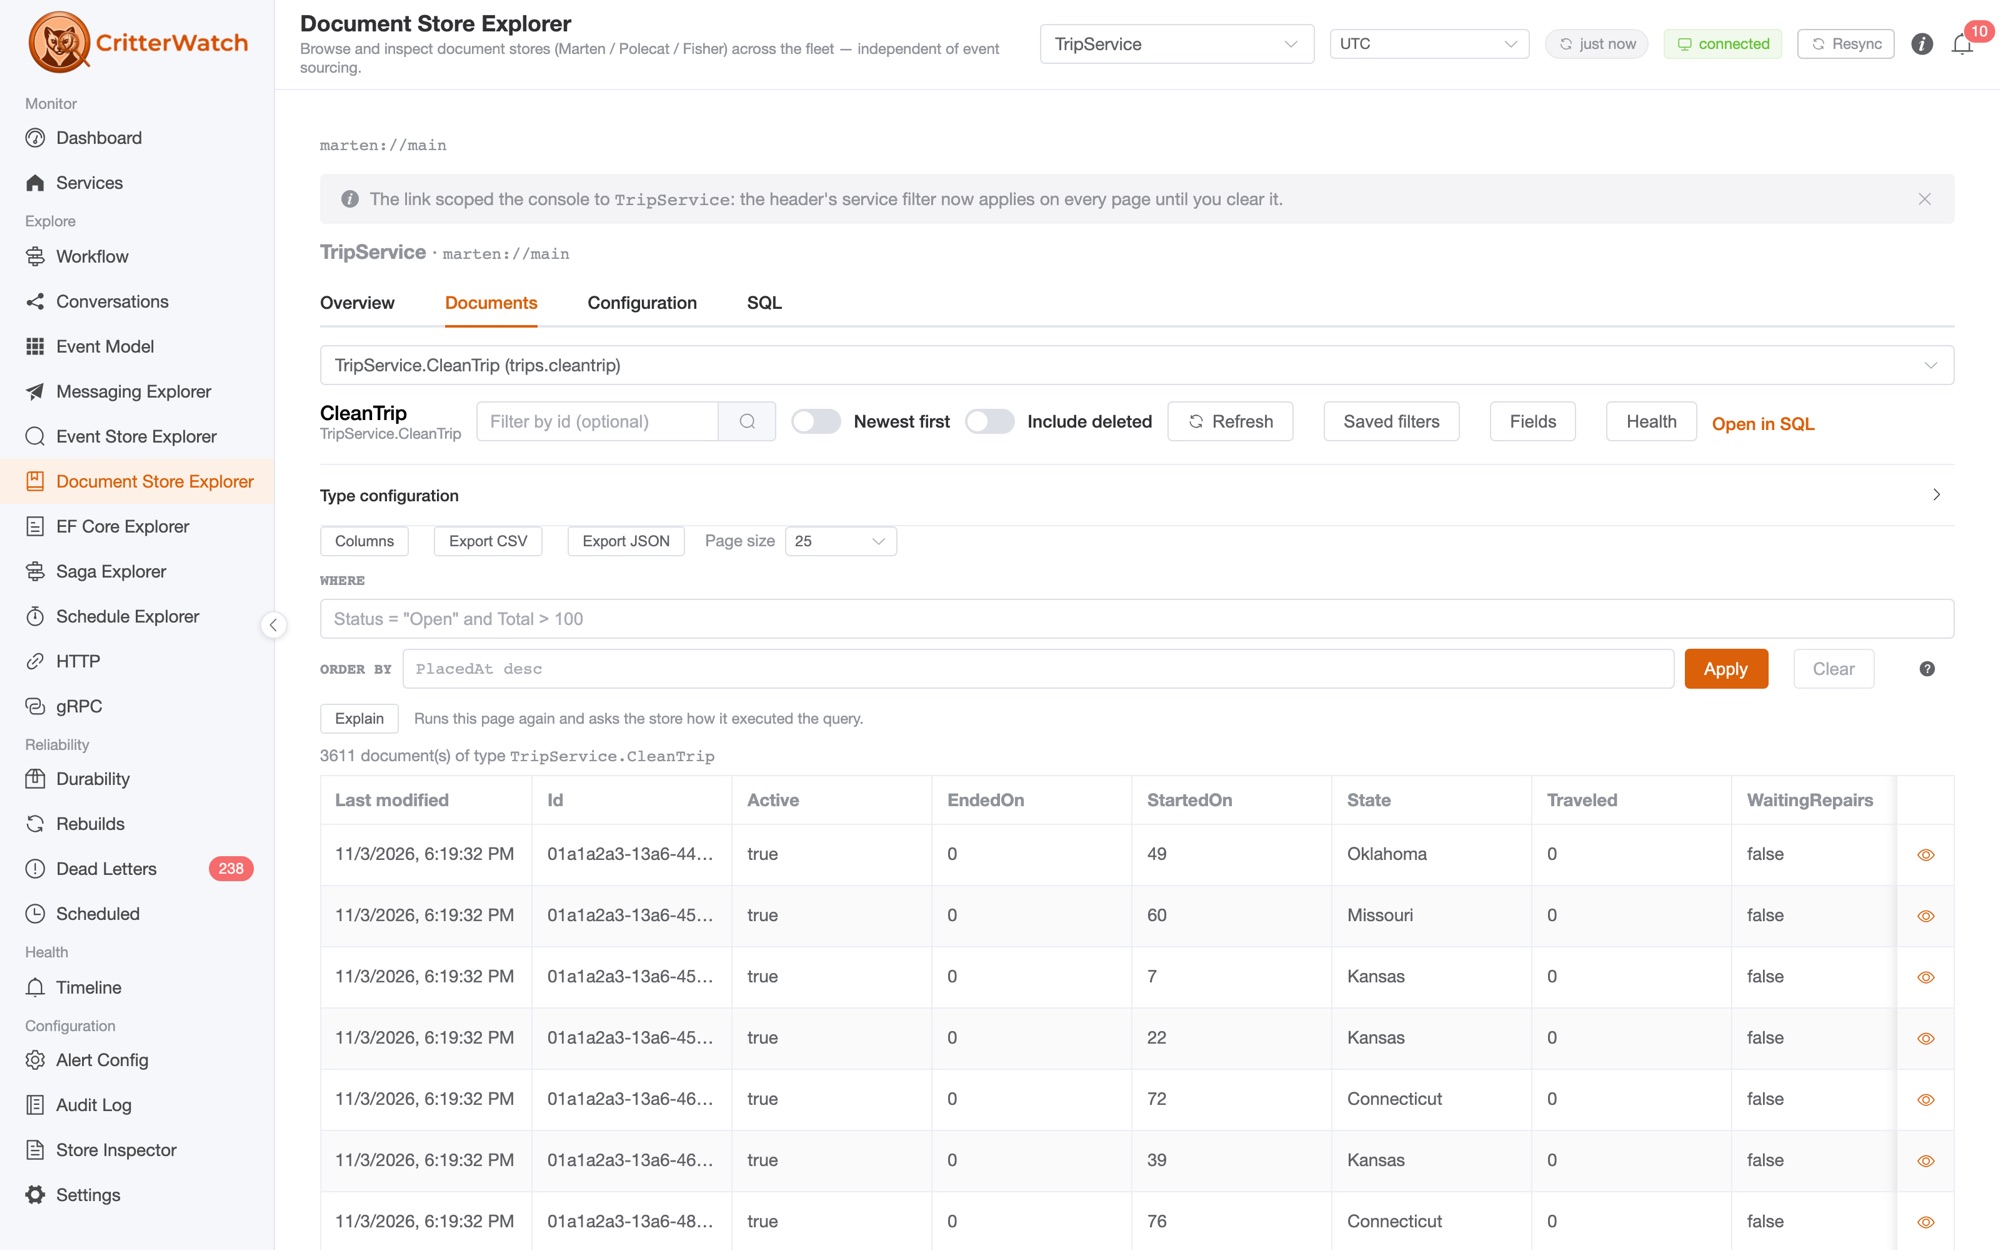
A cool new feature we hope people will like is Health. Pick a document type, and CritterWatch takes its oldest and newest documents through the service's own serializer and tells you which ones no longer deserialize, then compares the shape of the old documents against the new ones: members that went missing, members that appeared, members whose JSON type changed. That's exactly the class of problem that shows up after a deploy renames a property, and until now the first anyone heard of it was an exception in production.
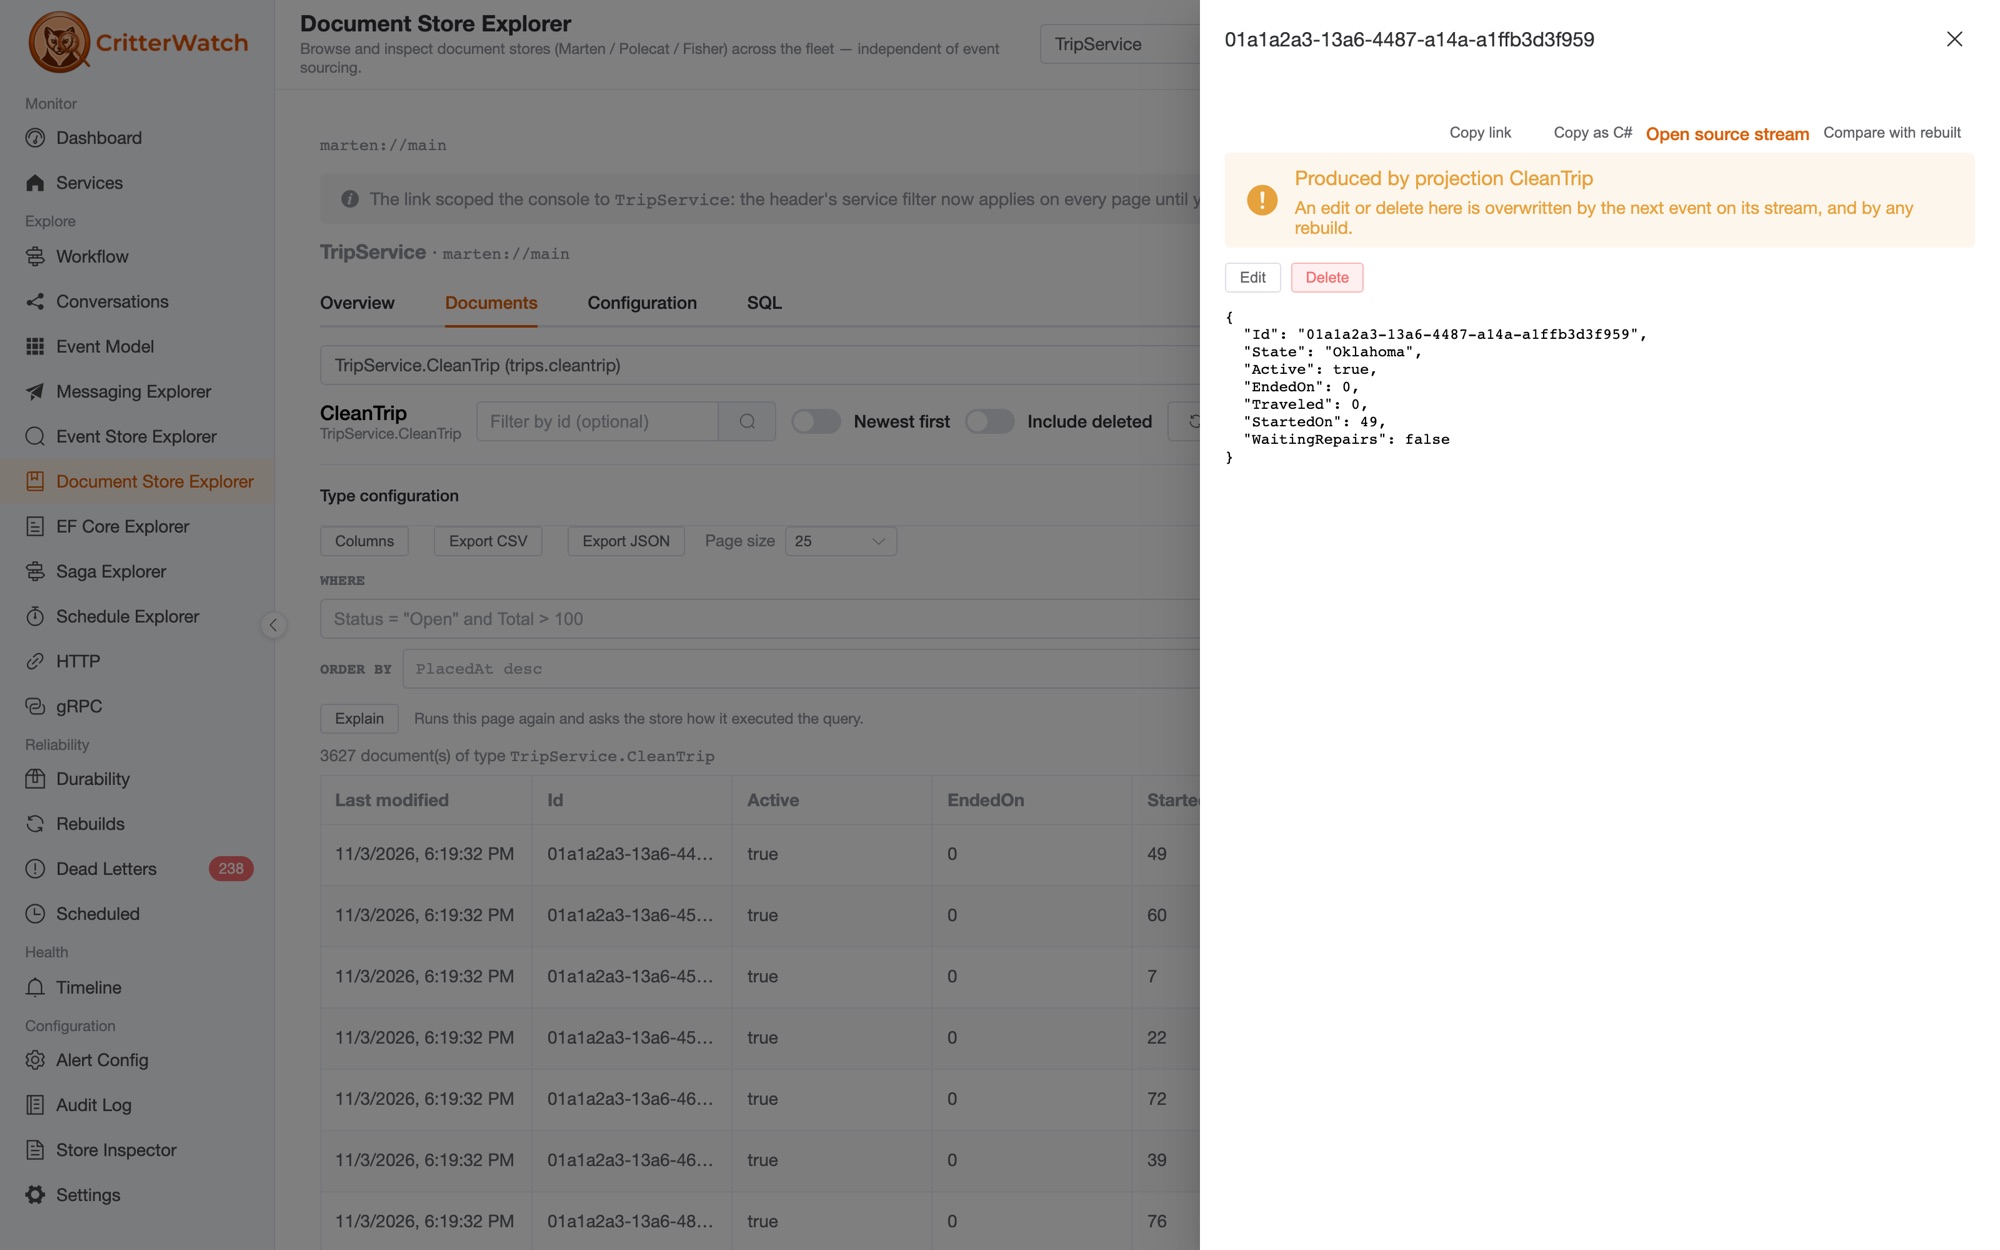
Beside it, Tenants counts a type per tenant, the type drawer shows its mapping configuration and DDL, and you can open any document to see it, edit it through the store, or follow it back to the projection and the stream that produced it.
And if a document filter you've saved is really a business rule ("orders stuck in Pending for more than an hour"), the bell beside it turns it into an alert. See the Document Store Explorer.
Where is my saga, and what is it waiting for?
Sagas are where "the message went in and nothing happened" lives. In 1.2 the Saga Explorer shows each saga's workflow as it's declared in your code:
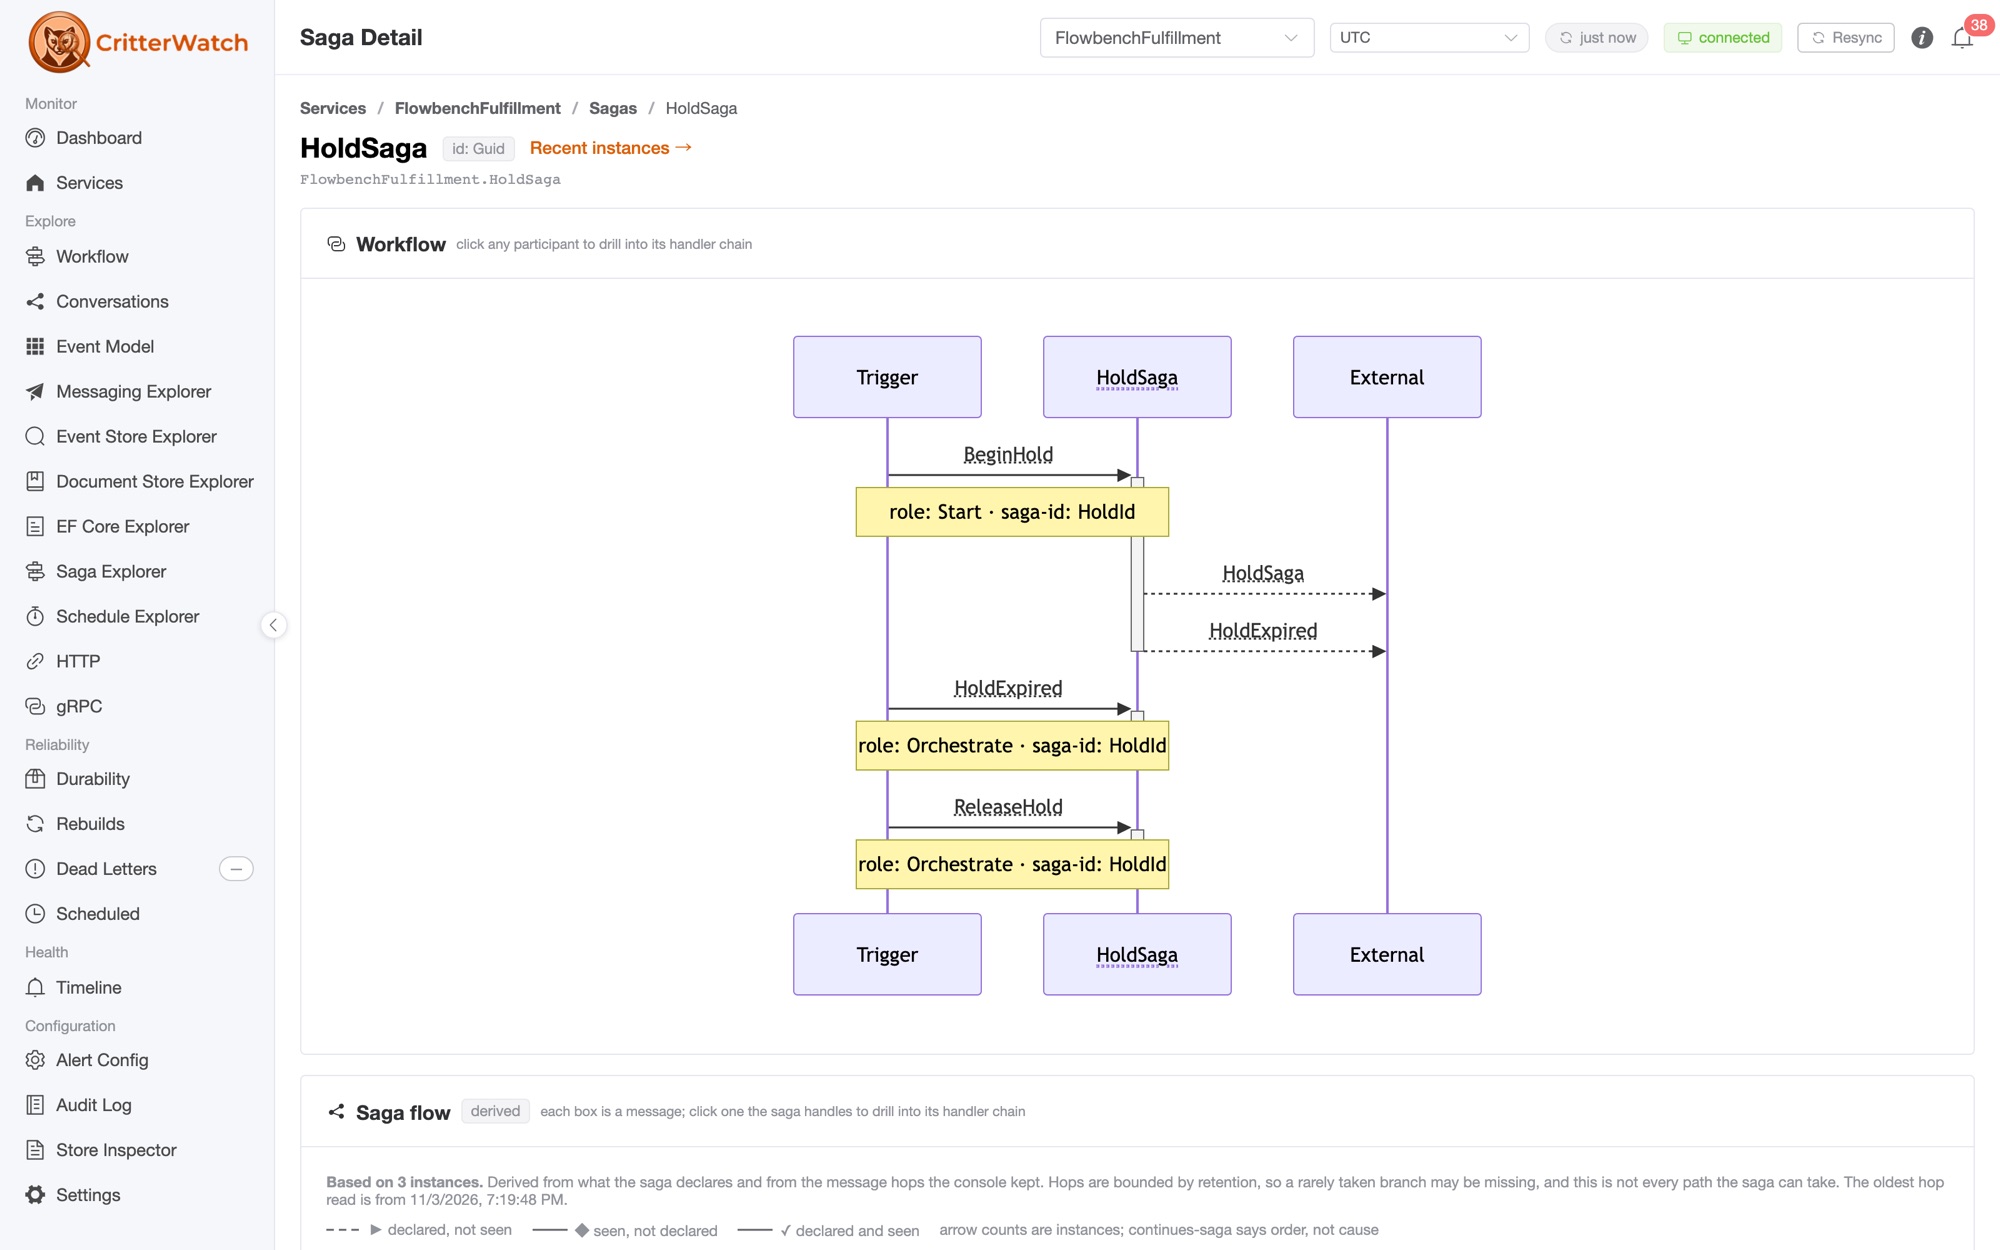
and, for any one instance, where it is now: the state as it sits in saga storage, the messages it has handled, its spans, and the timeouts it still has pending. The Saga flow draws what the saga declares beside what its instances were actually seen to do, so a branch your code allows but production never takes is plainly visible.
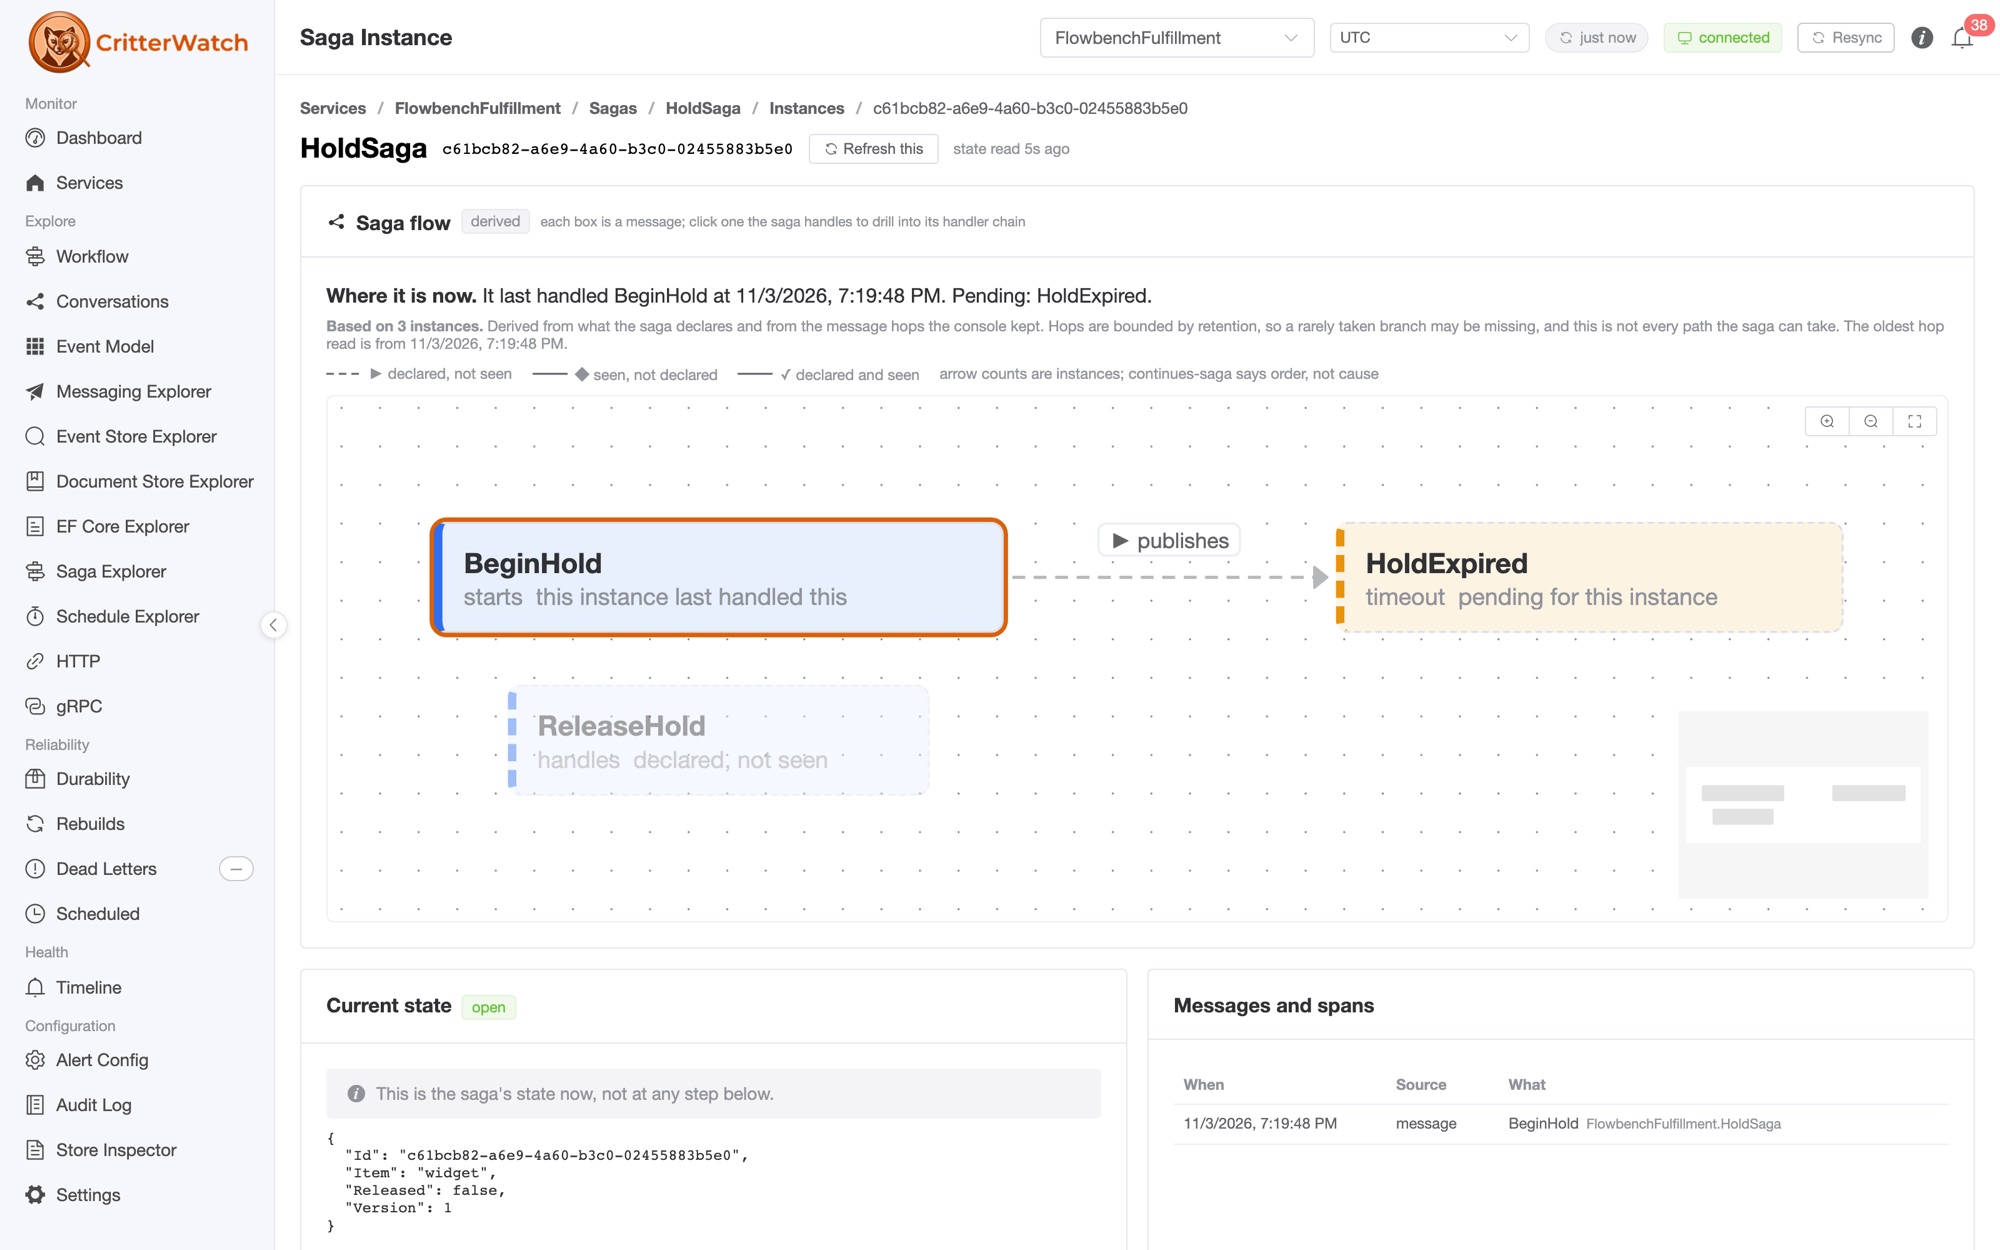
Agents get this too. Three new MCP tools, list_sagas, list_saga_instances and get_saga_instance, let an agent answer "where is order 4711's saga, and what's it waiting on?" without anybody opening the console. See the Saga Explorer and MCP › Sagas.
A Schedule Explorer that tells you what a schedule is doing
Wolverine's recurring schedules and CritterWatch's compaction policies all land in the Schedule Explorer, and in 1.2 it answers the questions an operator actually asks: does this schedule still fire, when will it next run, and if it failed, why?
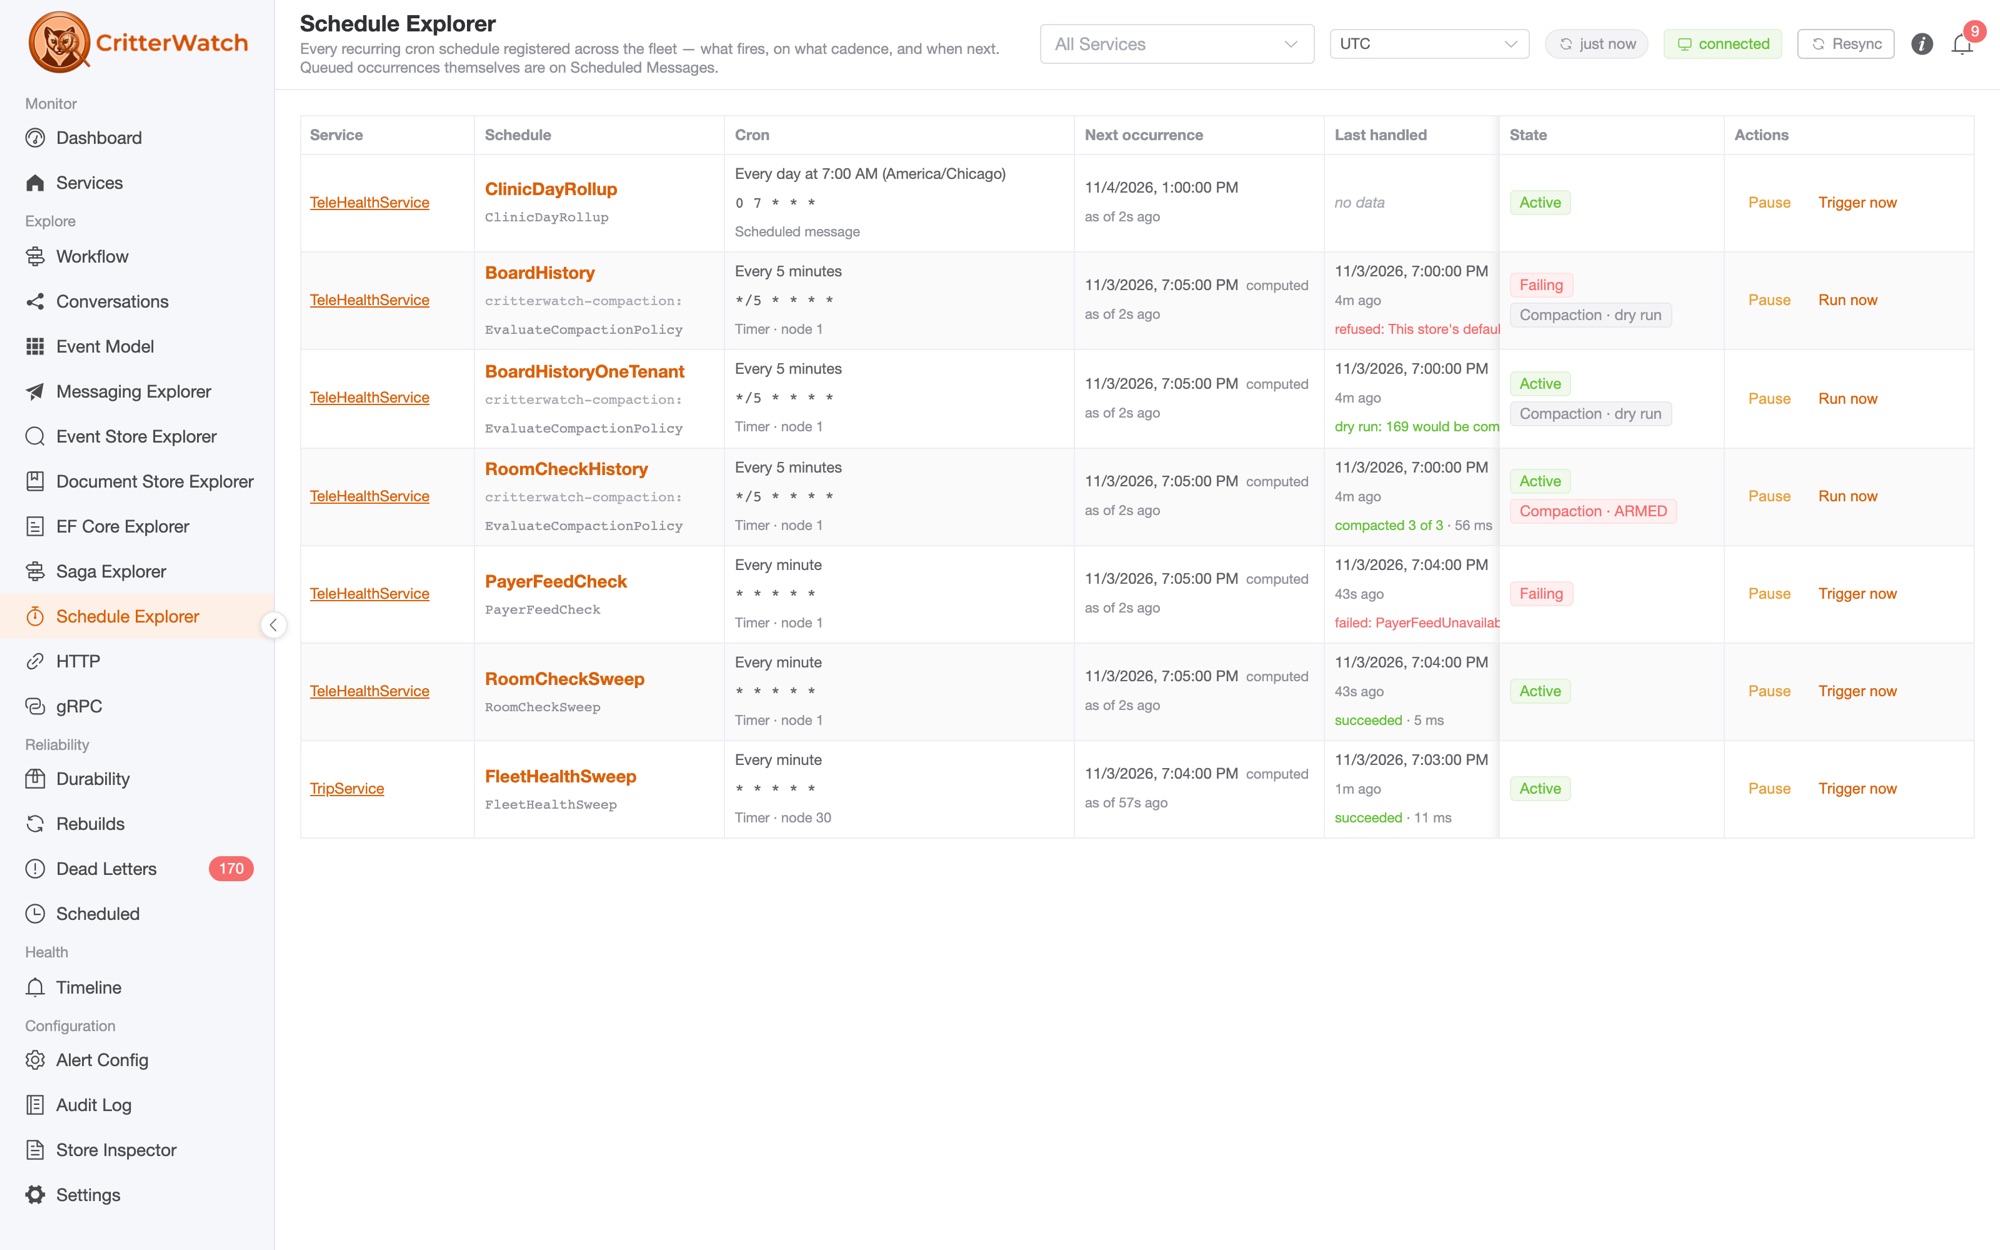
Every cron pattern has a plain-language label next to it ("Every day at 7:00 AM (America/Chicago)"), a schedule whose service has gone reads Service down instead of quietly looking healthy, "Trigger now" tells you when it will really run, and a compaction policy shows whether it's still in dry-run or armed. All times in the console now follow one display time zone that you pick in the header, UTC by default. See the Schedule Explorer.
The Event Model you can drill into
We've worked very hard on our "Event Modeling as Analysis" story for being able to specify and scaffold event sourced applications quickly, but the CritterWatch side of this is "here is the system visualized as it actually is."
The Event Model is its own screen in 1.2: you pick a service, and you get its commands, events and views as Event Modeling slices, merged from what your code declares and what CritterWatch has watched it do. Every card drills down to what it shows, the handler chain behind a command, the projection behind a view, so the model is a way into the running system rather than a picture of it. You can include or exclude message, command and event types, a command reached both over HTTP and by message shows both entry points, and CritterWatch now reads Wolverine's store-agnostic [DeciderFunction] handlers too.
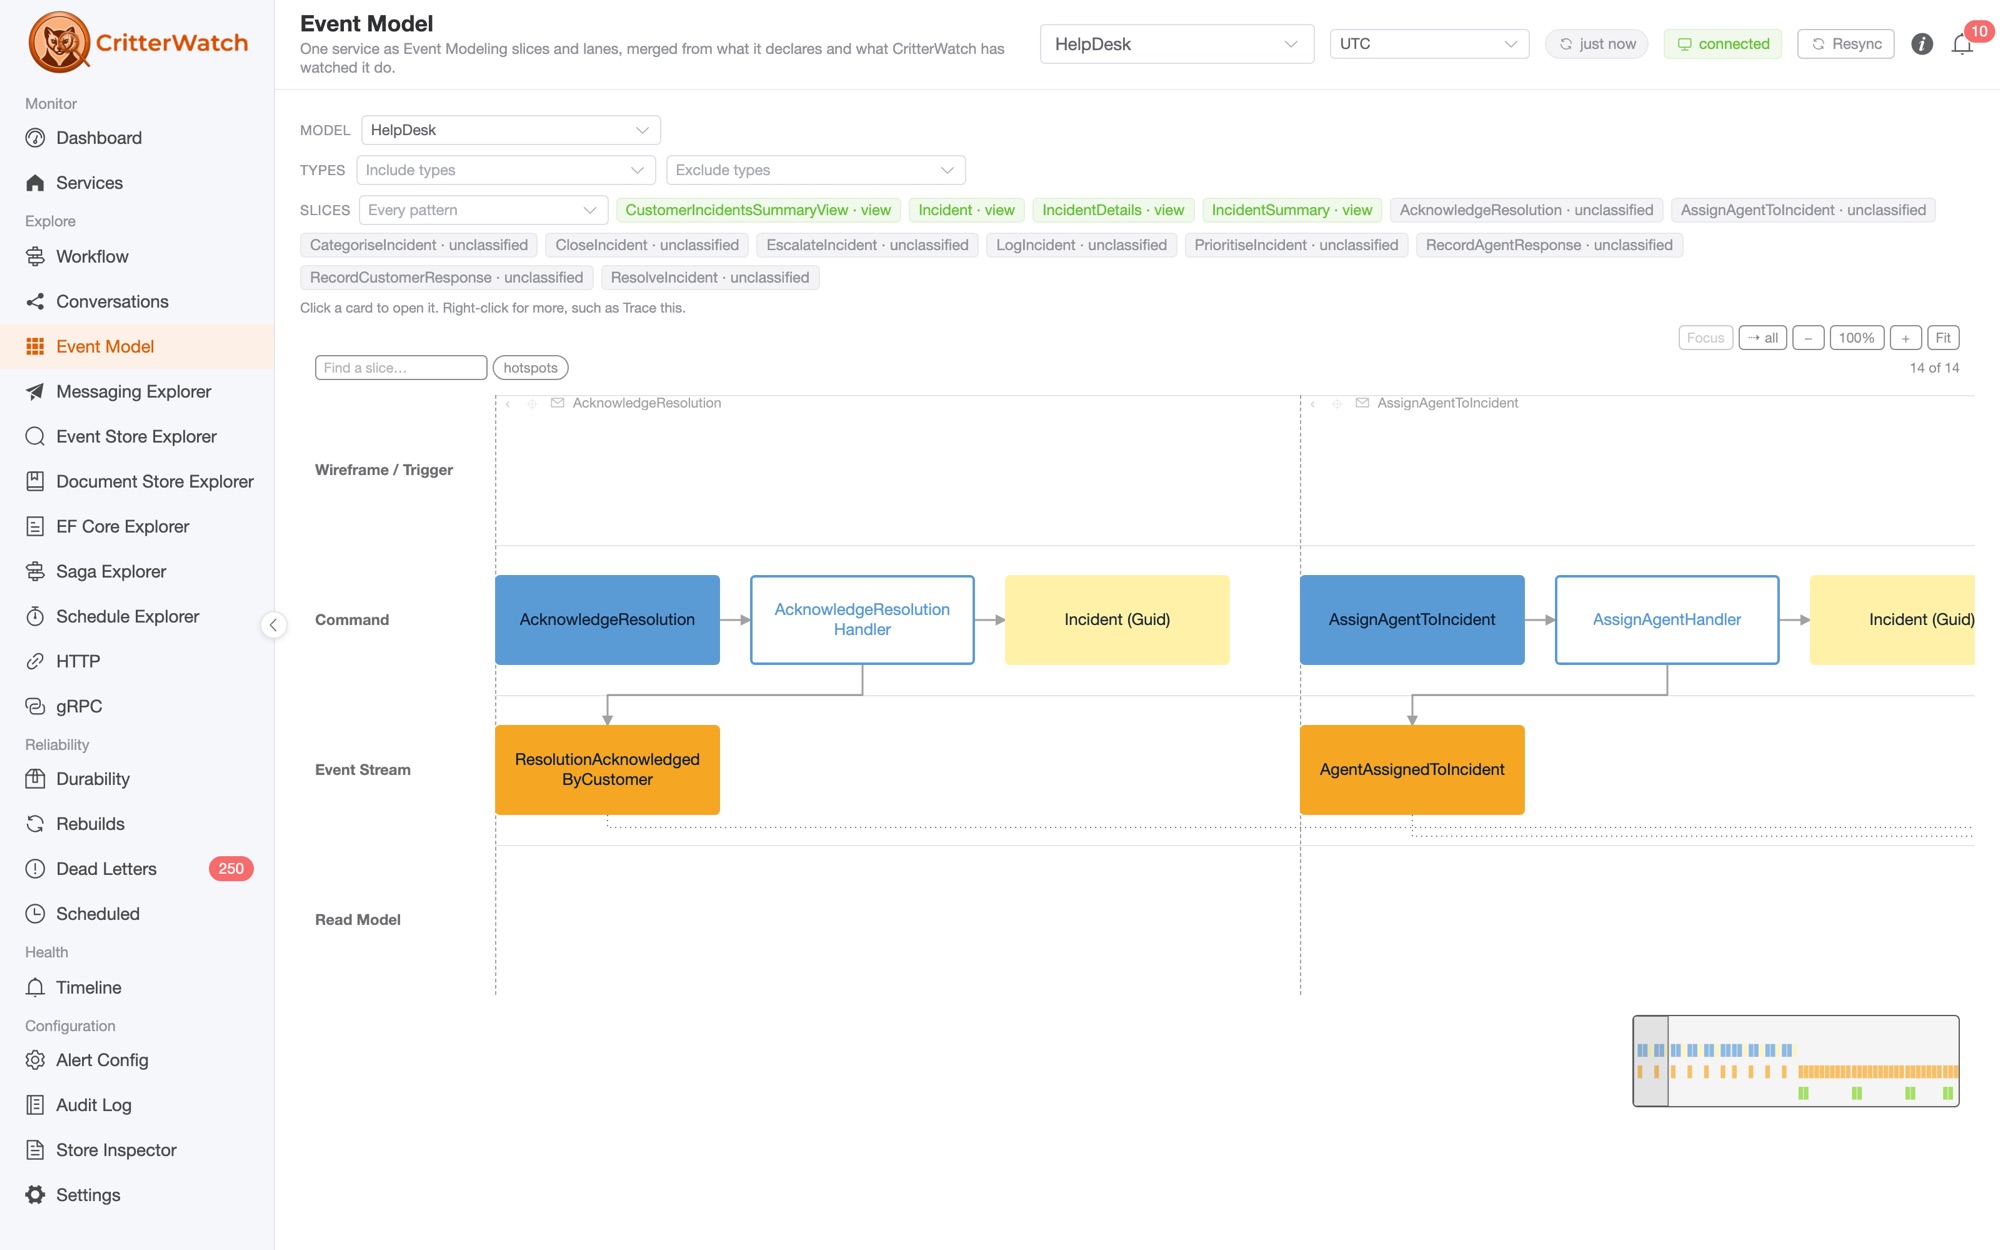
See Event Modeling.
And a lot more
The 1.2 release notes have the whole list. A few highlights:
- Conversations can be found by any id, service or message type. They start at the HTTP request that began them, and every span opens a pop-up that links to the handler, HTTP endpoint, gRPC method, Event Model slice, dead letter, or events it names. Moreover, the AI Skills know how to use this as an MCP endpoint for better AI assisted troubleshooting. It's basically teaching your AI agent how to easily query your OpenTelemetry spans (Jaeger, Application Insights and the like) in terms of the application internals.
- AI explains a dead letter failure group: summary, probable cause, transient or permanent, suggested next step. It's labelled as a suggestion, never a diagnosis, and runs only when you ask. AI alert triage now reaches Slack and webhook channels too.
- PagerDuty and email notification channels for paging.
- Runtime pressure: every node reports process CPU and managed heap, with a
NodeRuntimePressurealert. - A Grafana board pack for teams that already live in Grafana.
- Listener pause and restart reach every node, and a command a service refuses no longer reads as success, in the console or over MCP.
- Console actions check what their MCP twins check, so the RBAC capabilities mean the same thing whichever way an operator acts.
Getting it
CritterWatch 1.2 is on NuGet as CritterWatch (Marten / PostgreSQL), CritterWatch.SqlServer (Polecat) and CritterWatch.Sqlite (Fisher, no database server at all), with Wolverine.CritterWatch 1.2 in each monitored service. It's built on Wolverine 6.61, Marten 9.57, Polecat 5.48 and Fisher 1.27. Older 1.x services keep working against a 1.2 console; the upgrade notes say which features need the 1.2 client.
Read-only monitoring needs no license. Operator actions, the audit log and the whole MCP server are part of a commercial license: tiers and pricing are in the CritterWatch plans section of our products page, every JasperFX support plan offers CritterWatch as an add-on, and you can now generate a trial license on demand to evaluate CritterWatch first. Questions and bug reports go to JasperFx/ProductSupport or the #CritterWatch room in the Critter Stack Discord.