

JasperFx Software is proud to announce CritterWatch 1.0 RC 1 today. This is the first release candidate for the 1.0 release. CritterWatch is available on NuGet under the BSL license — many read-only features are usable as-is, but a commercial license is required for the full functionality including the MCP integration and every operator action.
Where everything lives
- Documentation — critterwatch.jasperfx.net is the full reference: installation, transport options, deployment and clustering, RBAC, and a page per console surface.
- Report a bug or request a feature — the JasperFx/ProductSupport repository on GitHub is the public issue tracker for CritterWatch, the AI Skills, and our other commercial products. RC feedback belongs there, and we'd genuinely like to have it before 1.0 final.
- Talk to us — come find us in the Critter Stack Discord. There's a dedicated #CritterWatch room; that's the fastest way to get a question in front of the people who wrote this.
- Buy a license — the CritterWatch plans section on our products page has the Starter / Professional / Enterprise tiers and their per-service limits, with a buy link on each. You can also request a trial license to evaluate it before you commit.
- Or bundle it with support — every JasperFX support plan includes our AI Skills collection and offers CritterWatch as an add-on, and it's included outright with Premium (Enterprise tier, unlimited services). If you were already weighing a support contract, that's usually the better arithmetic.
Since 0.8.0 landed in June, roughly 900 commits have gone into CritterWatch. Rather than walk that changelog, this post is organized around the four things we think CritterWatch is for:
- Understanding the system you actually shipped — visualizations assembled from the running code, not from a diagram someone drew a year ago.
- Knowing when it's in trouble — an alert taxonomy and performance history built for the Critter Stack specifically.
- Handing your AI assistant a real control surface — 43 MCP tools, and the questions they can answer.
- Managing the event store — projections, shards, rebuilds, and the explorer that makes them legible.
TL;DR —
dotnet add package CritterWatch --version 1.0.0-RC.1for the console host,dotnet add package Wolverine.CritterWatch --version 1.0.0-RC.1in every app you want to monitor, point them at a shared PostgreSQL and the transport of your choice, and you're live.
What is CritterWatch?
CritterWatch is a multi-application monitoring and operations console built specifically for the Critter Stack. Where a general-purpose APM tool sees "an HTTP endpoint" or "a SQL query," CritterWatch sees:
- Wolverine message handlers, listeners, agents, schedules, nodes, sagas, durability, and routing conventions.
- Marten / Polecat event stores, projections, shards, dead-lettered events, async daemons, and per-tenant partitioning.
- The cross-application topology — every service, every node, every projection, on one screen.
It's a Vue 3 SPA backed by a Wolverine + Marten BFF, packaged as a self-contained NuGet that embeds the frontend. You stand up the console, add one line to each monitored Wolverine app, and the console builds its picture of the world from the telemetry those apps publish.
1. Understanding the system you actually shipped
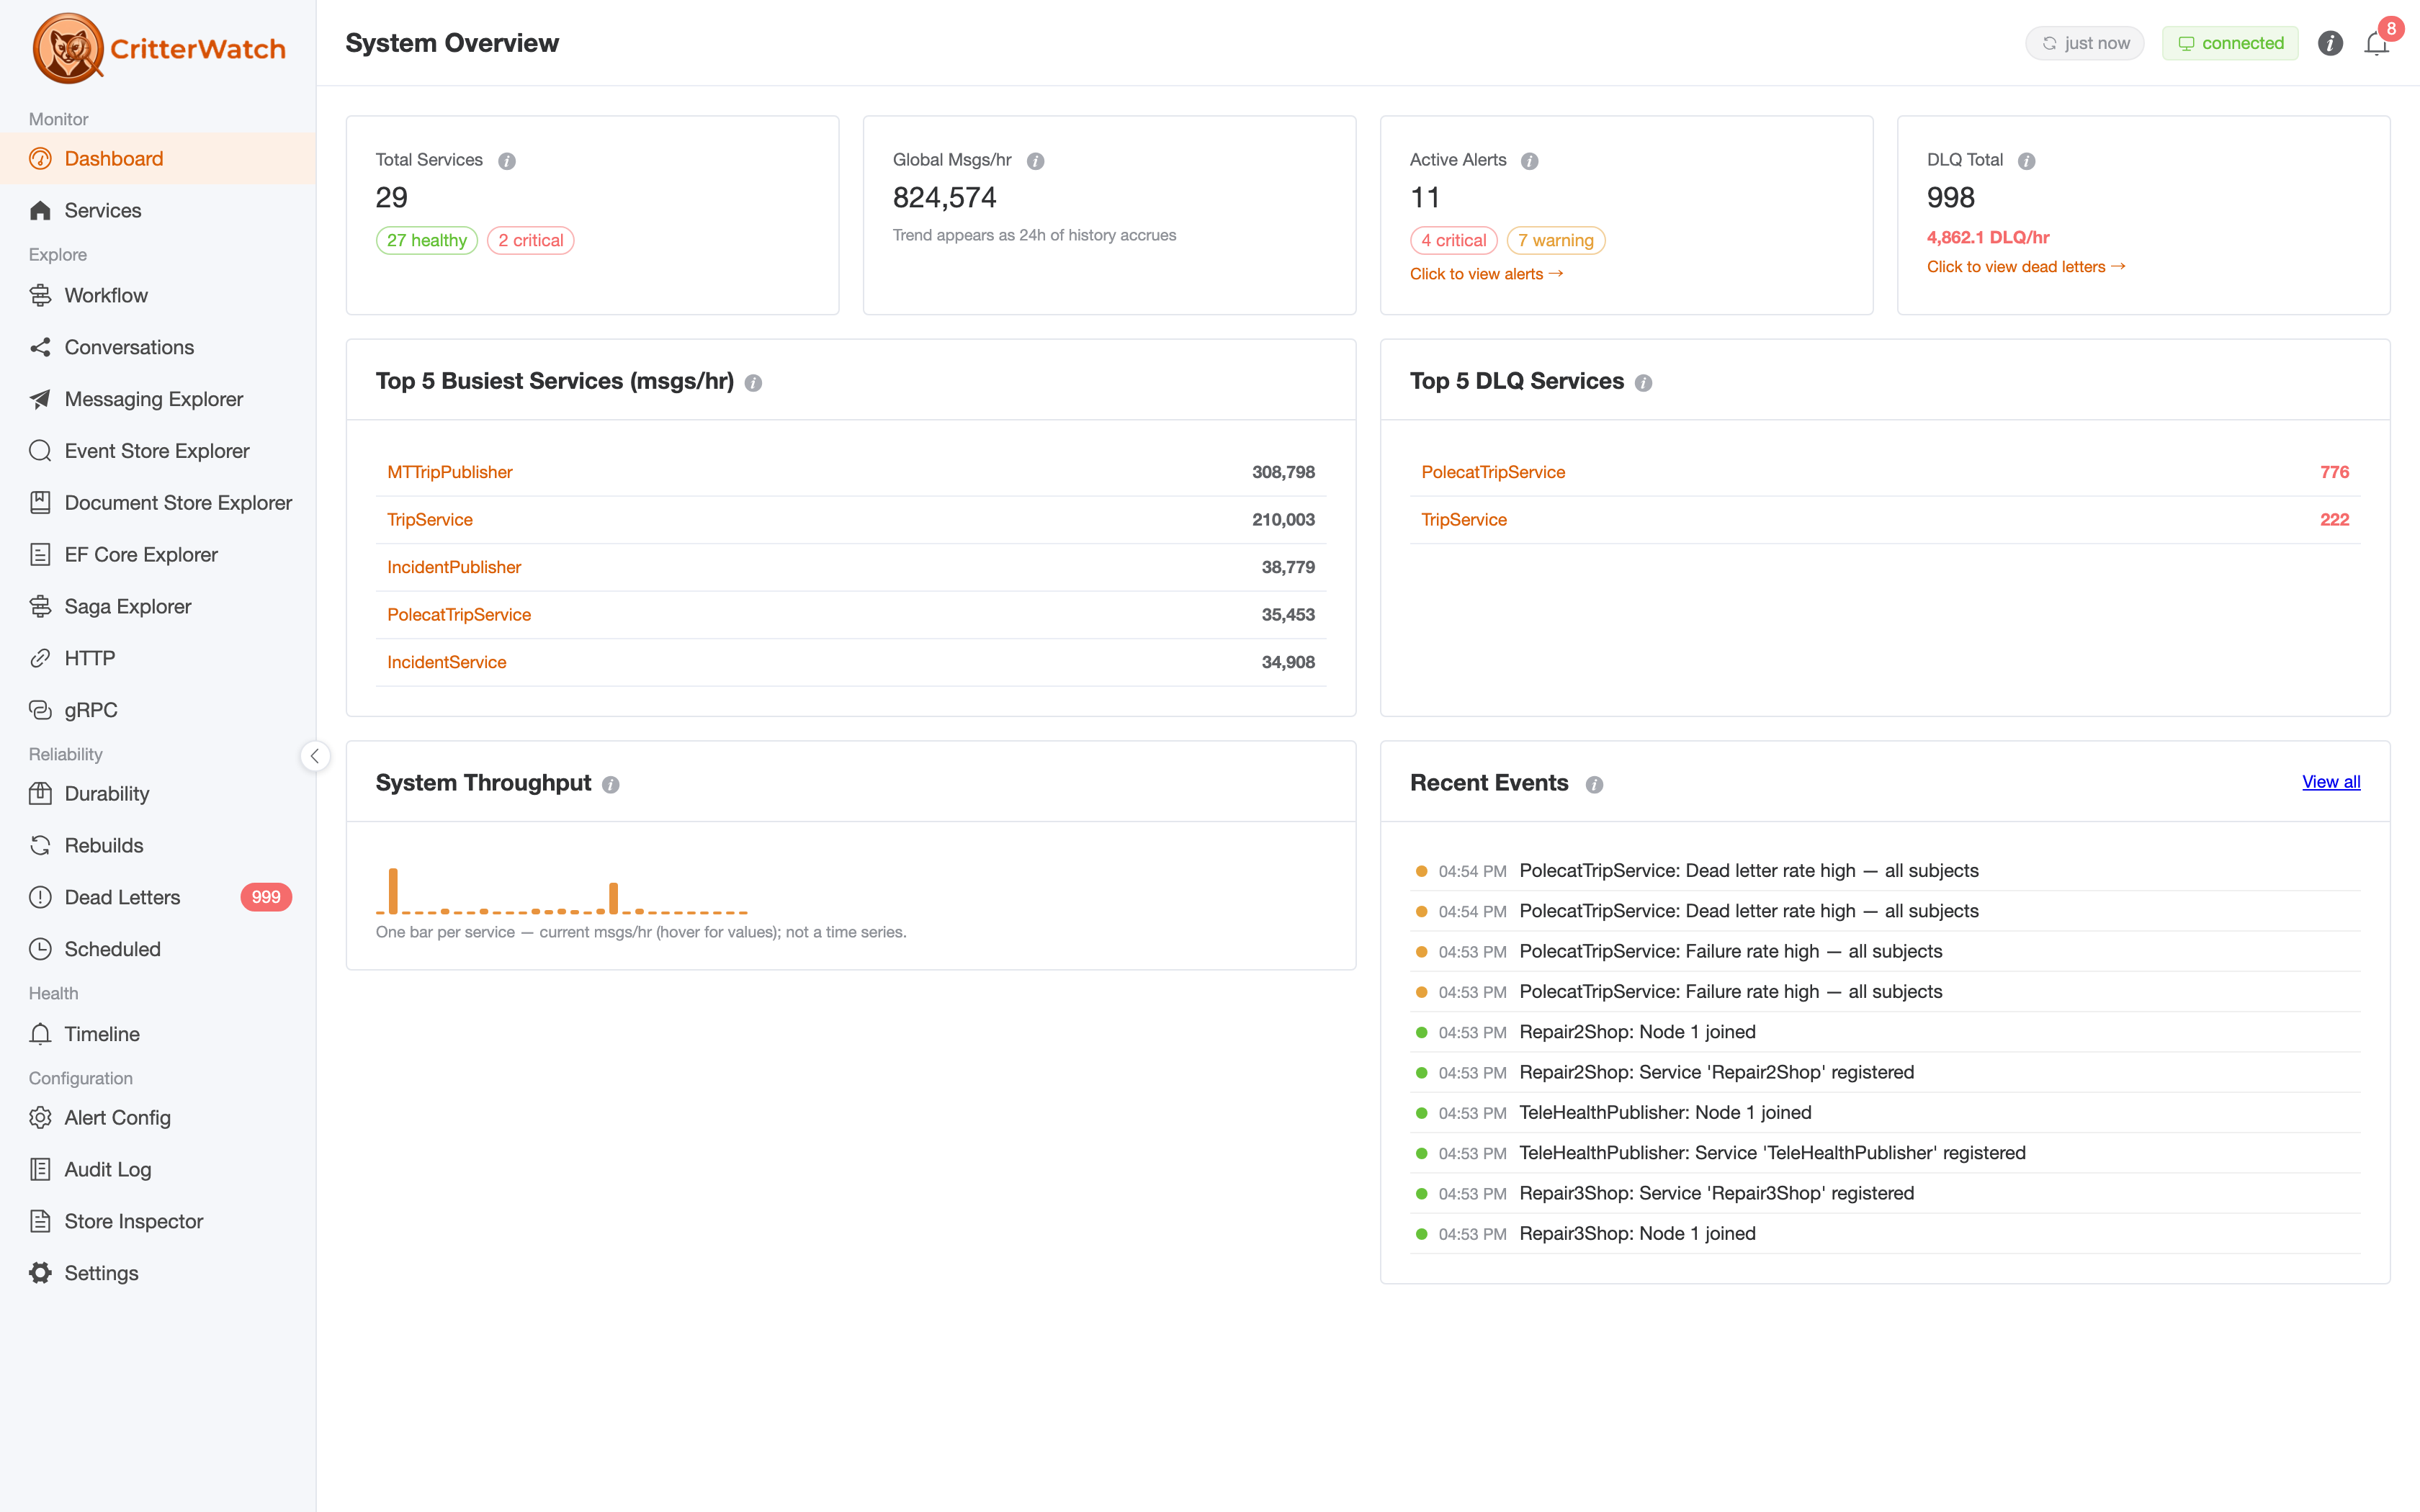
Most monitoring answers operational questions — is it up, is it keeping up, what's stuck. A second and quieter set of CritterWatch screens answers a structural one instead: what is this system, actually?
These screens read your running Critter Stack application back to you. Not from a wiki page, not from a .drawio file that stopped being true three sprints ago — from the assembled lifecycle model, Wolverine's own ActivitySource, the projection code the service actually executes, and the schema Marten and Wolverine actually installed. If the picture is wrong, the system is wrong.
The Workflow graph — "where does this type fit?"
Seed the Workflow page on any message, event, or saga type and it draws that type's complete lifecycle across every monitored service — who produces it, who handles it, what that handler cascades, which projections consume it, where it crosses a service boundary.
What makes it more than a diagram is that it unions three sources and tells you which is which:
- Inferred edges — from the static code structure Wolverine and the source generator can see.
- Observed edges — from real runtime causation captured as messages actually flowed.
- Confirmed edges — both agree.
So a single graph shows you where the shape you think you built and the behavior you actually get diverge. An inferred-but-never-observed edge is a code path nothing exercises. An observed-but-not-inferred edge is something happening that nobody drew.
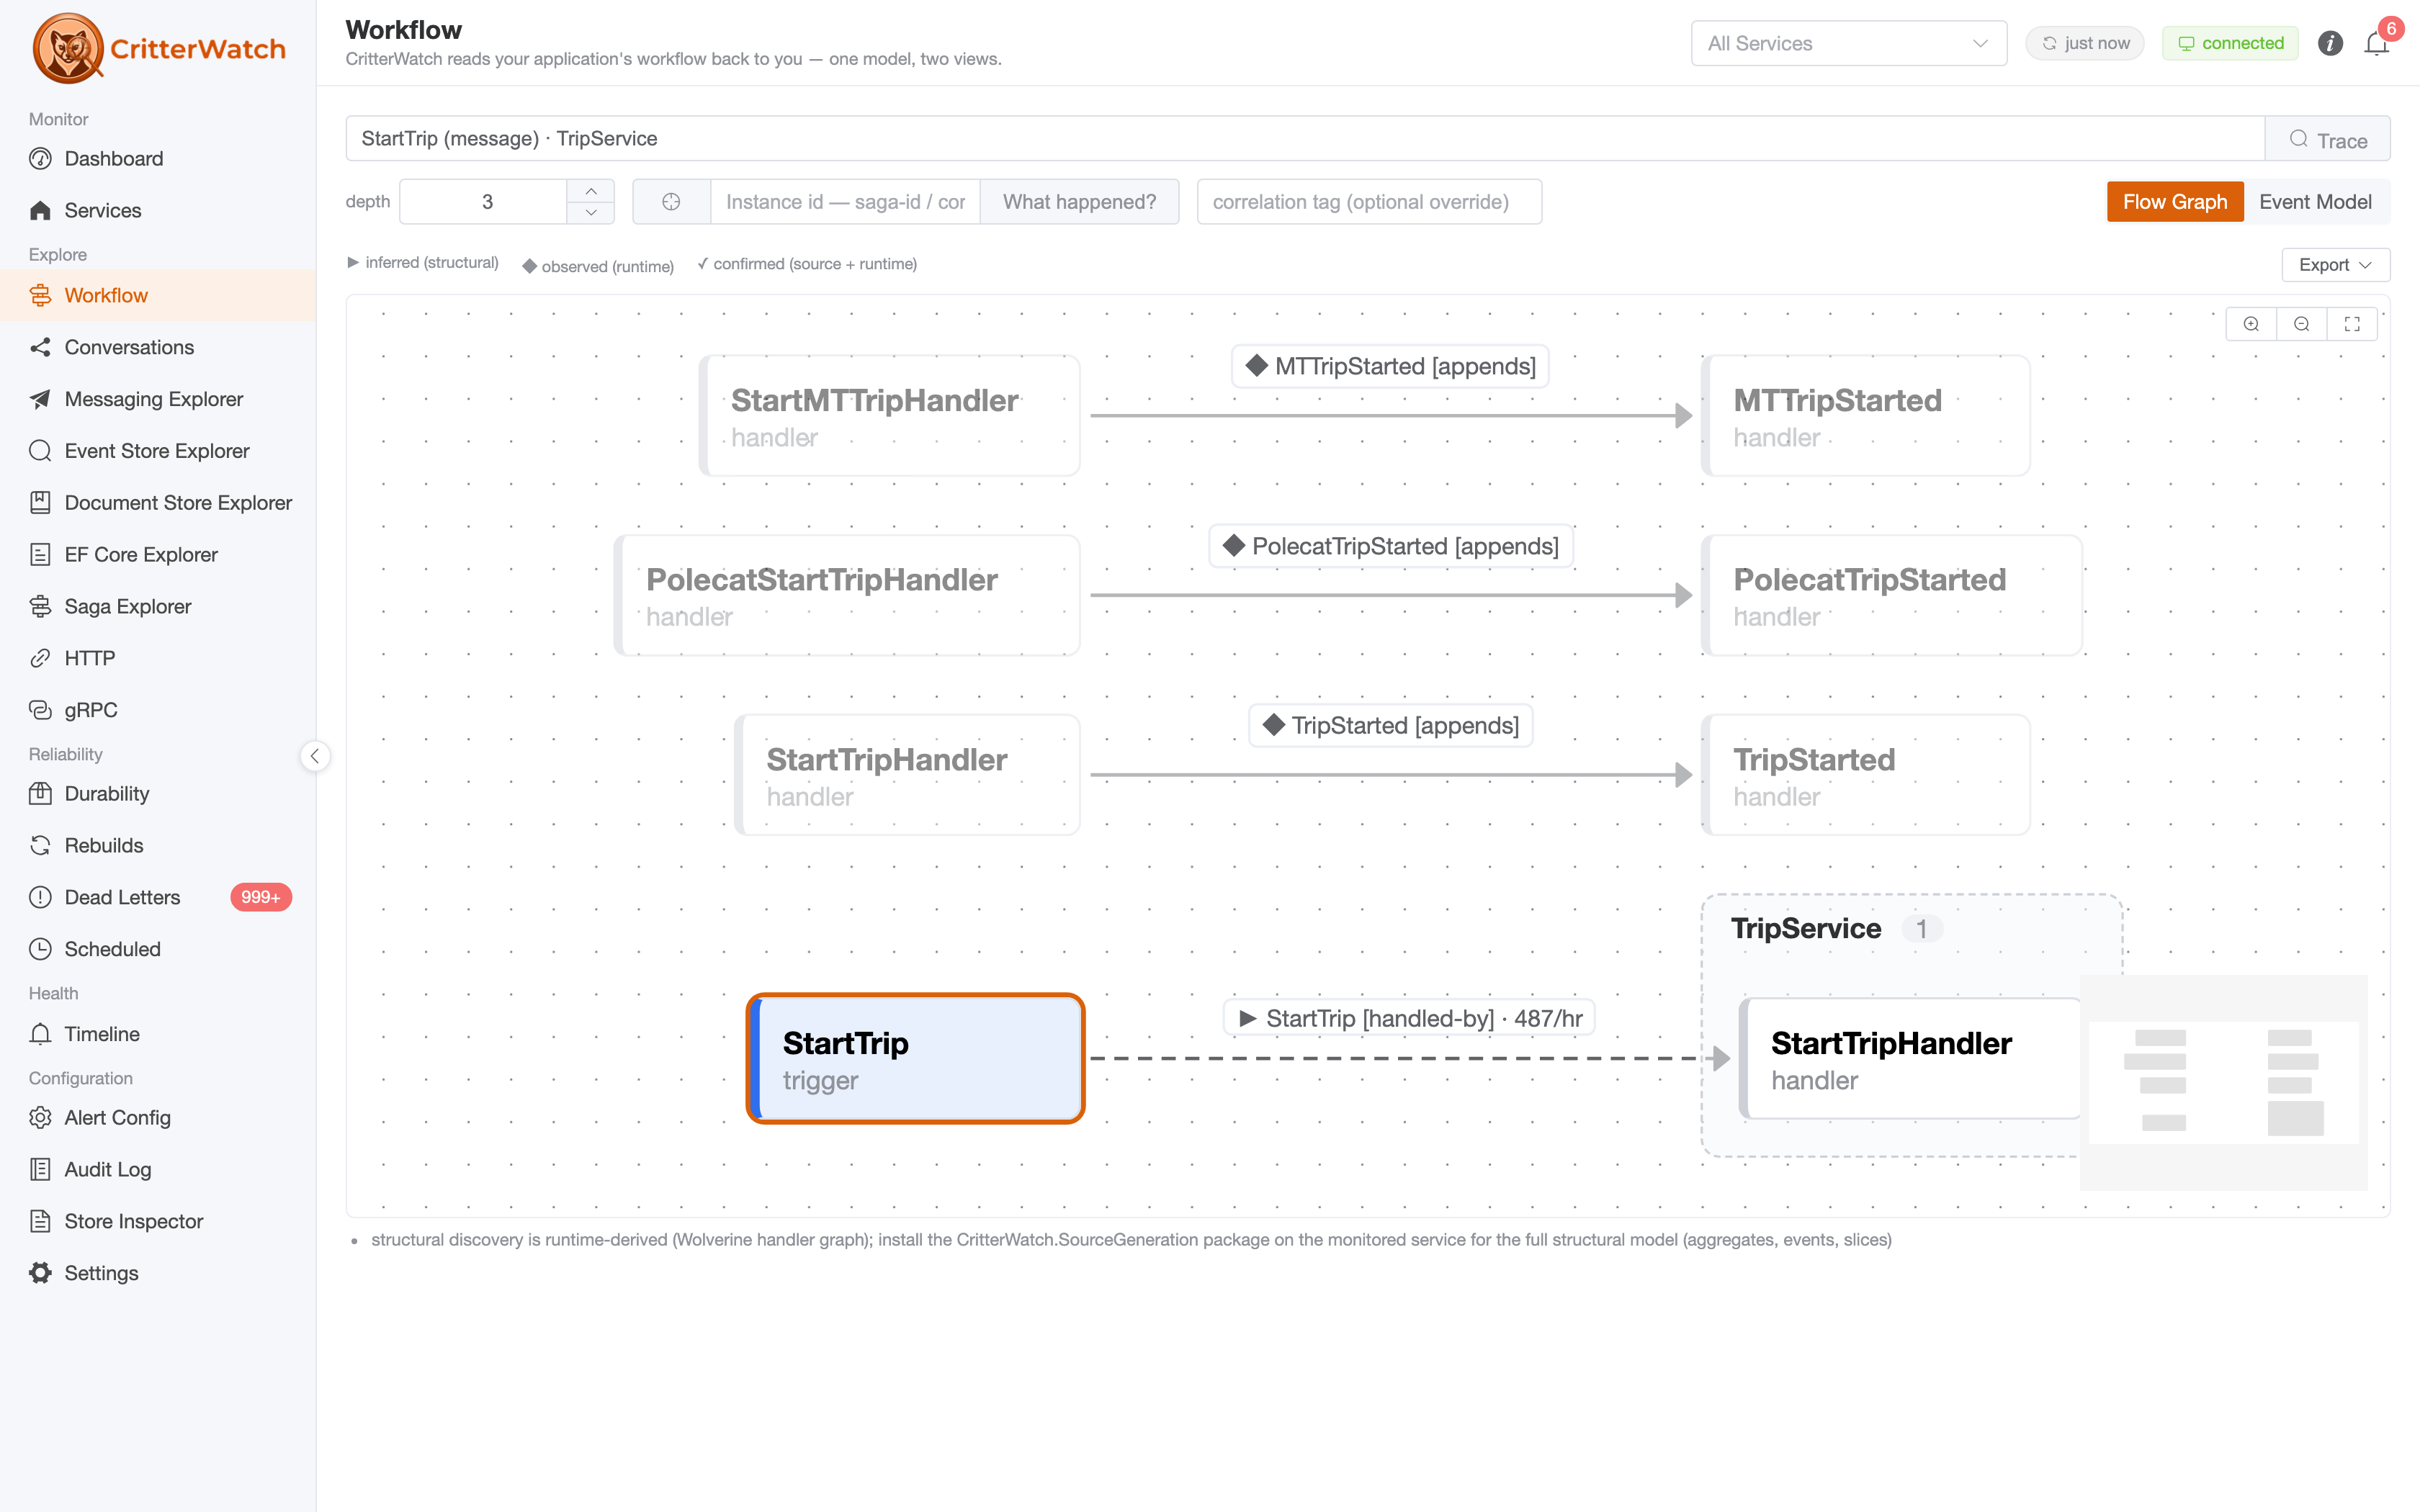
Note the legend across the top of the graph, and the markers on each edge — ▶ inferred, ◆ observed, ✓ confirmed. The StartTrip [handled-by] edge is annotated with its live rate, because this is being read off a running fleet.
The Event Model swim-lane
For event-sourced services, the Event Model view lays the service out as an Event Modeling swim-lane: command → event → projection → read model, left to right, in lanes. Click a handler node to read the C# Wolverine generated for it; click a projection node to drop straight into the Projection Stepper (more on that below).
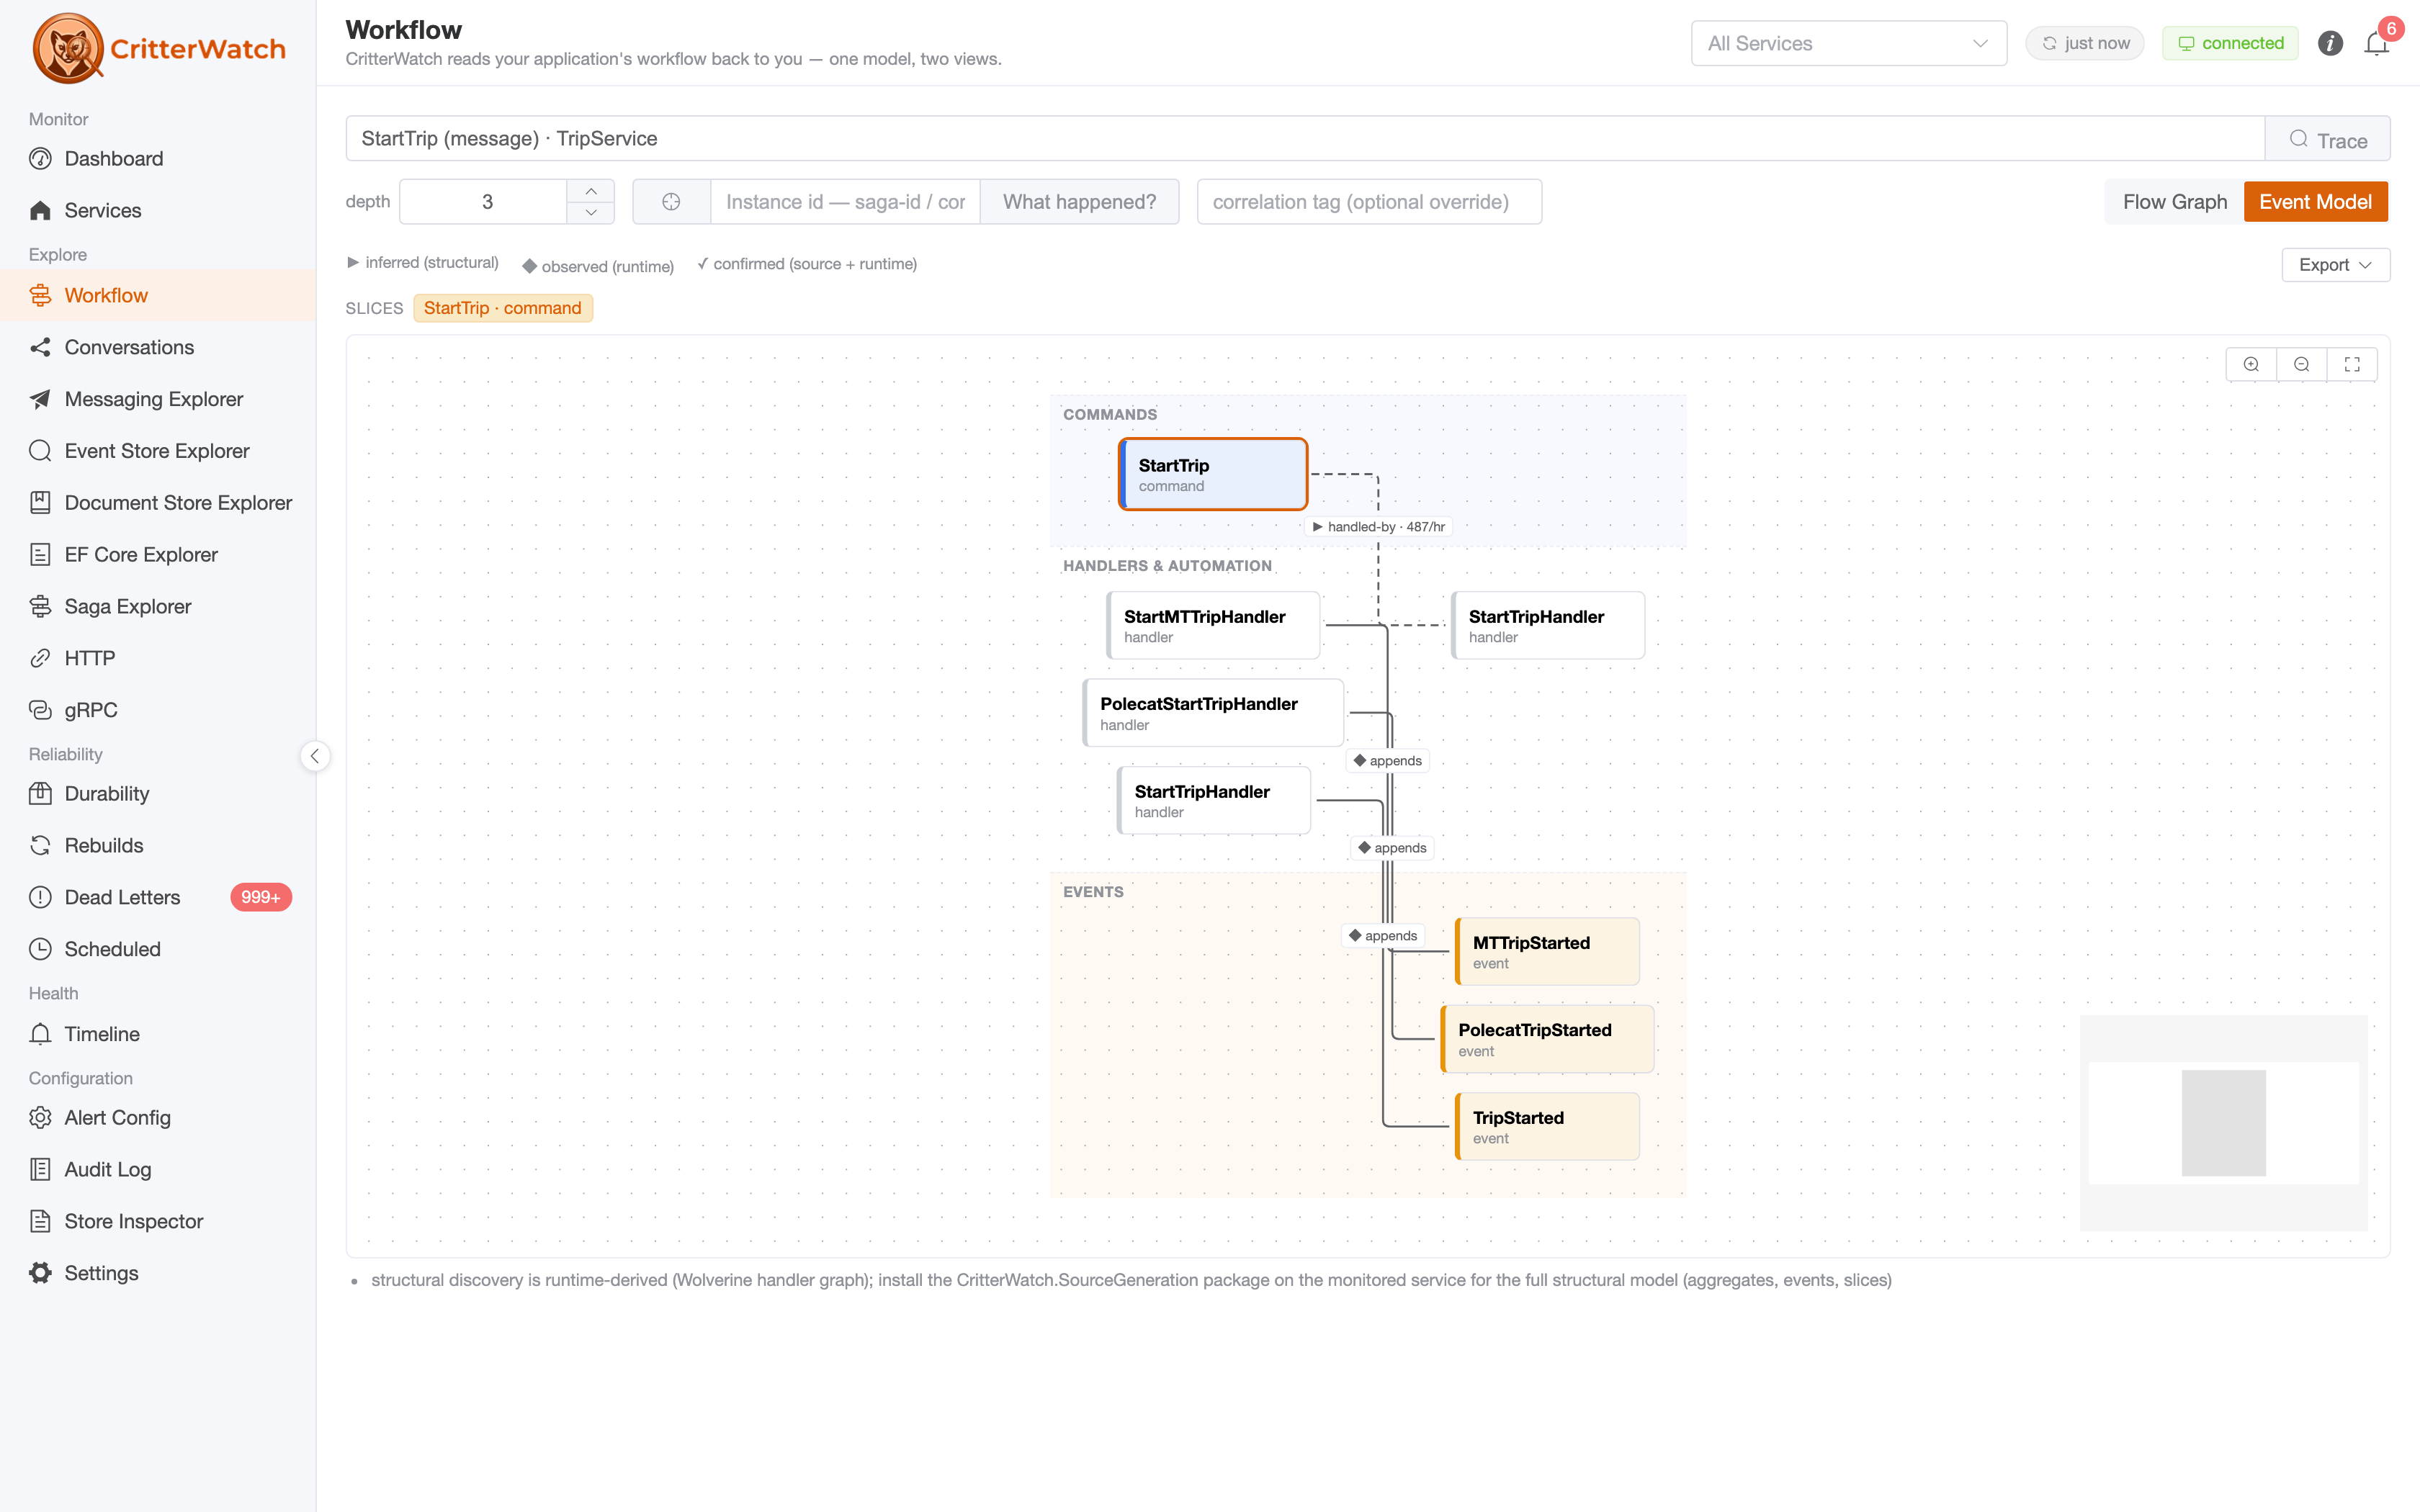
Richness scales with what the service tells us. Every service renders from runtime observation alone, filling in as traffic flows. A service that references CritterWatch.SourceGeneration also contributes a statically discovered manifest, so its lanes come through fully populated before a single message moves — the shape is known from the code rather than inferred from load.
Message Topology — the routing graph
Message Topology is the routing-only view for when the question is simply "who sends this, and who handles it?" It carries a Modular Monolith view for the increasingly common case where the "distributed system" is one process with well-drawn internal seams, plus causation chains and filtering when the full fleet graph gets busy.
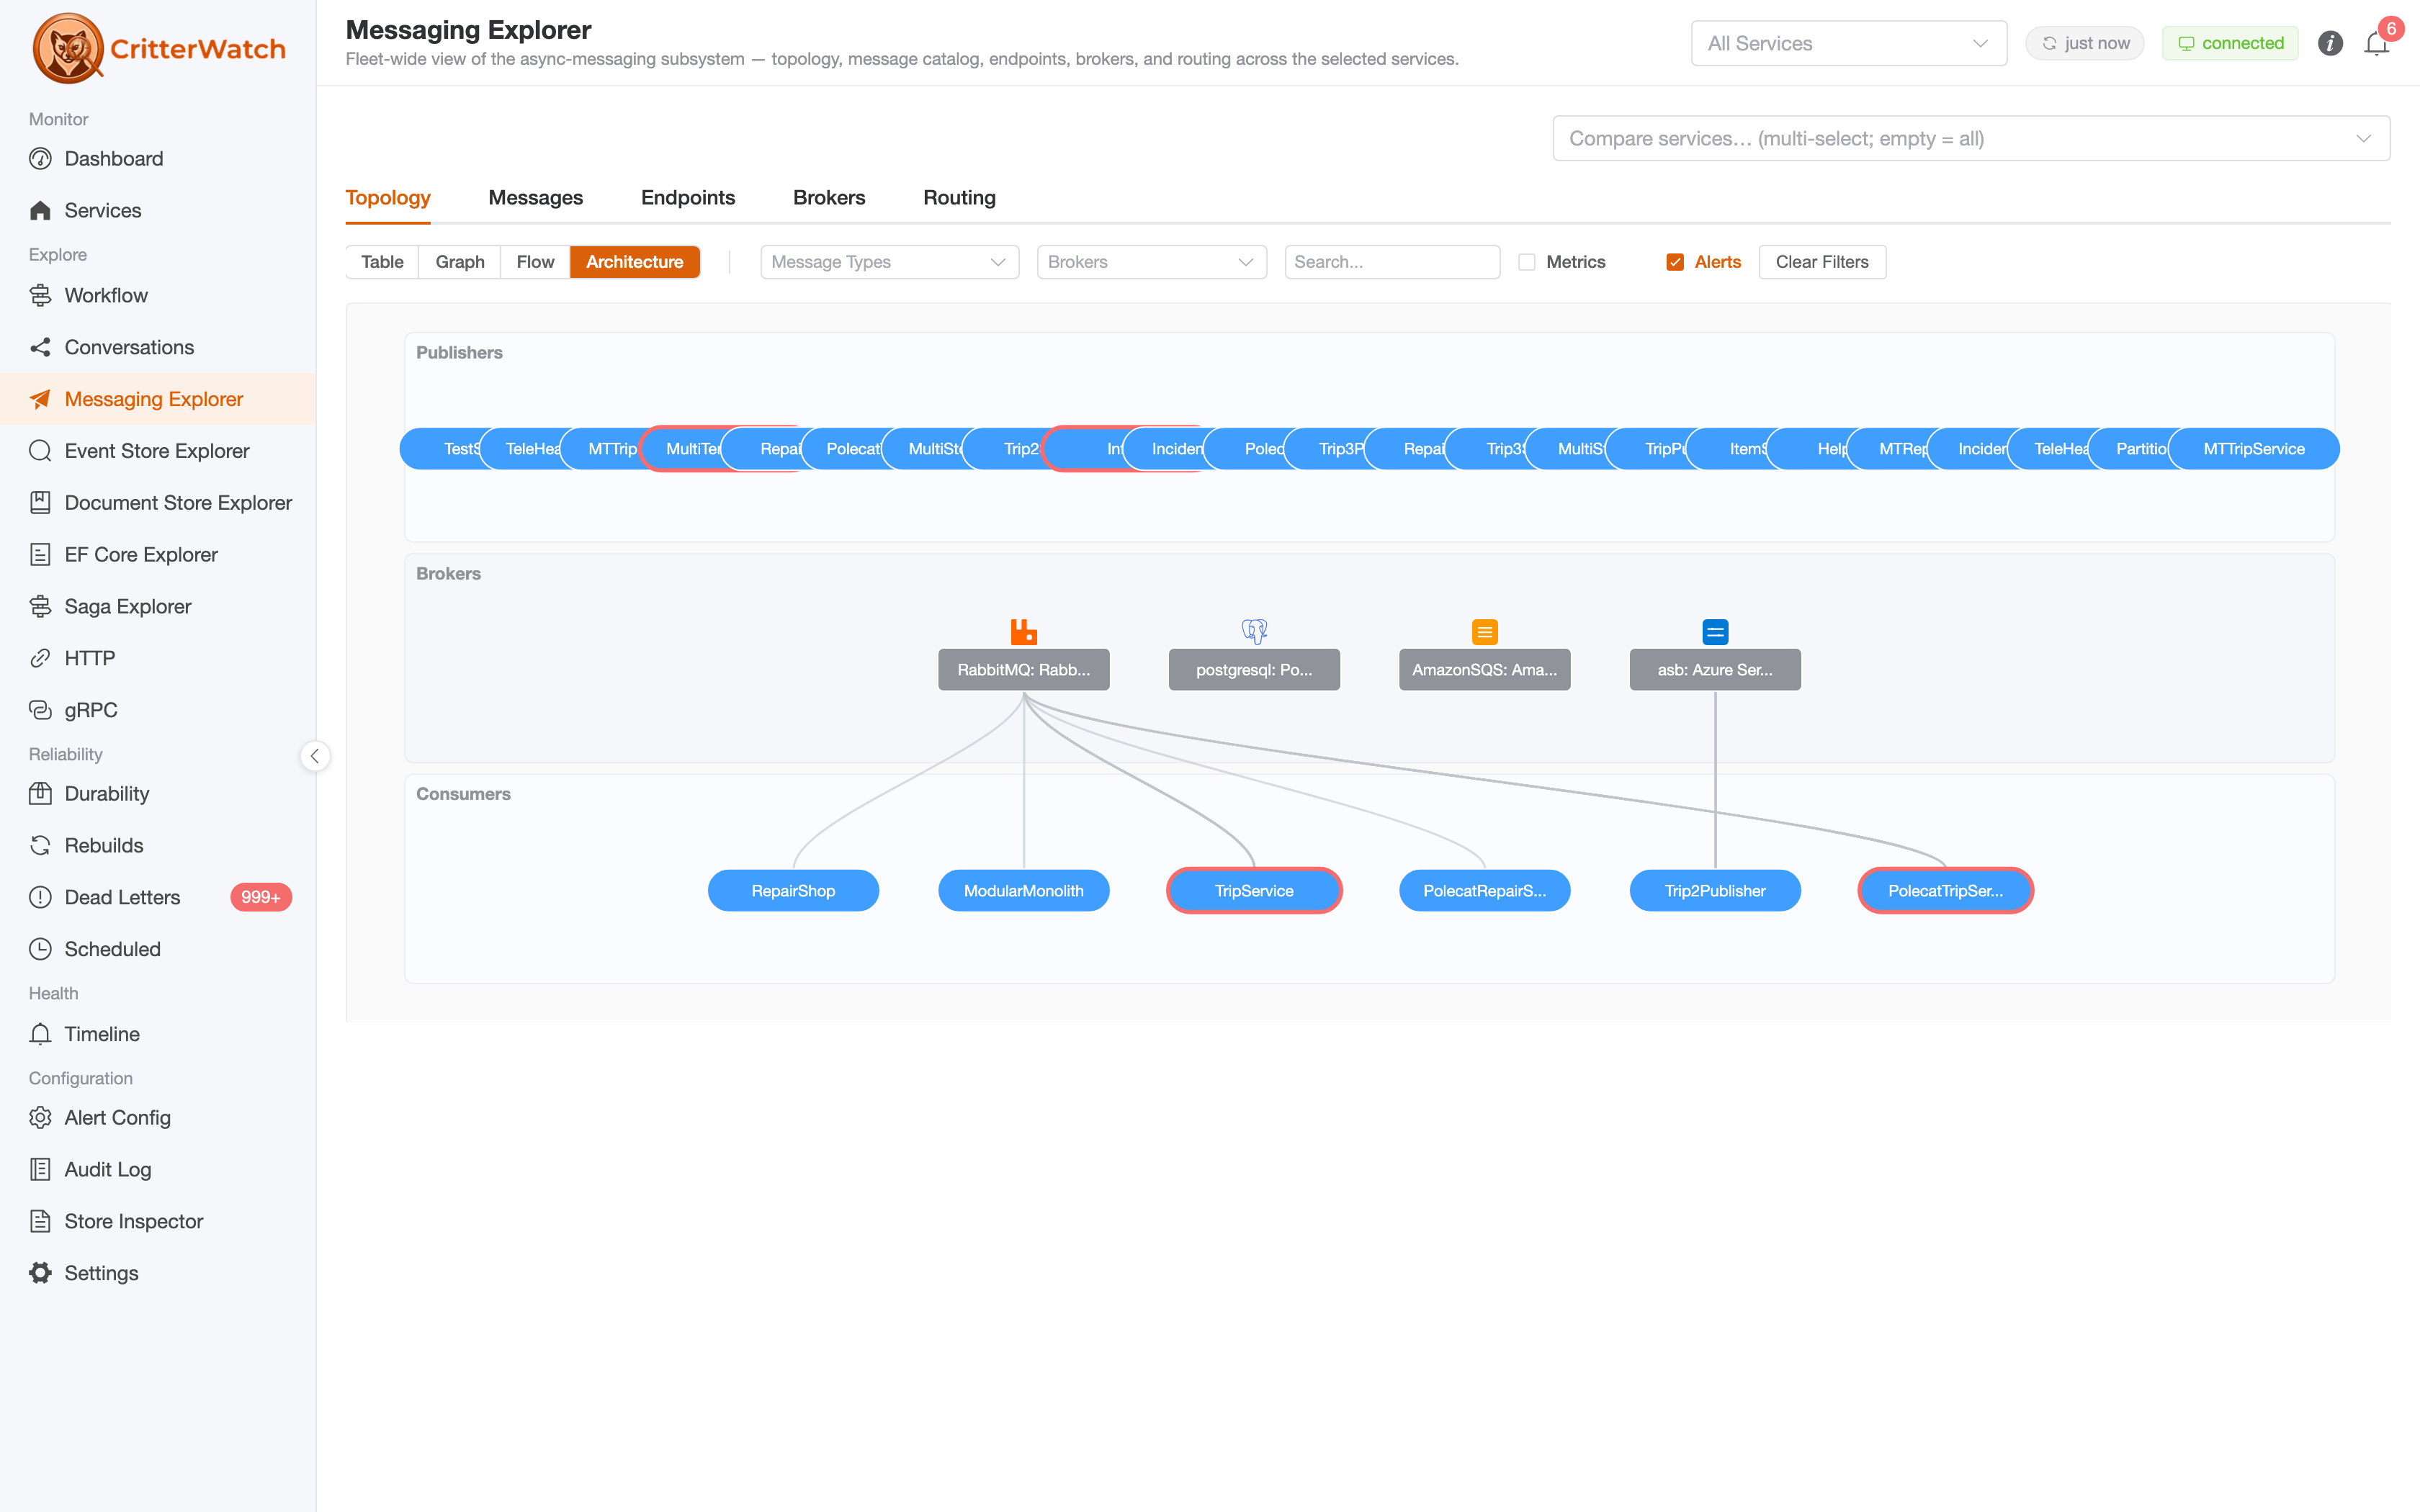
That's one screen covering four different brokers and every service on both sides of them. The same tab also carries Table, Graph, and Flow renderings of the same data, plus a Messages catalog, an Endpoints list, a Brokers view, and the Routing explainer.
Conversations — "what happened to this one?"
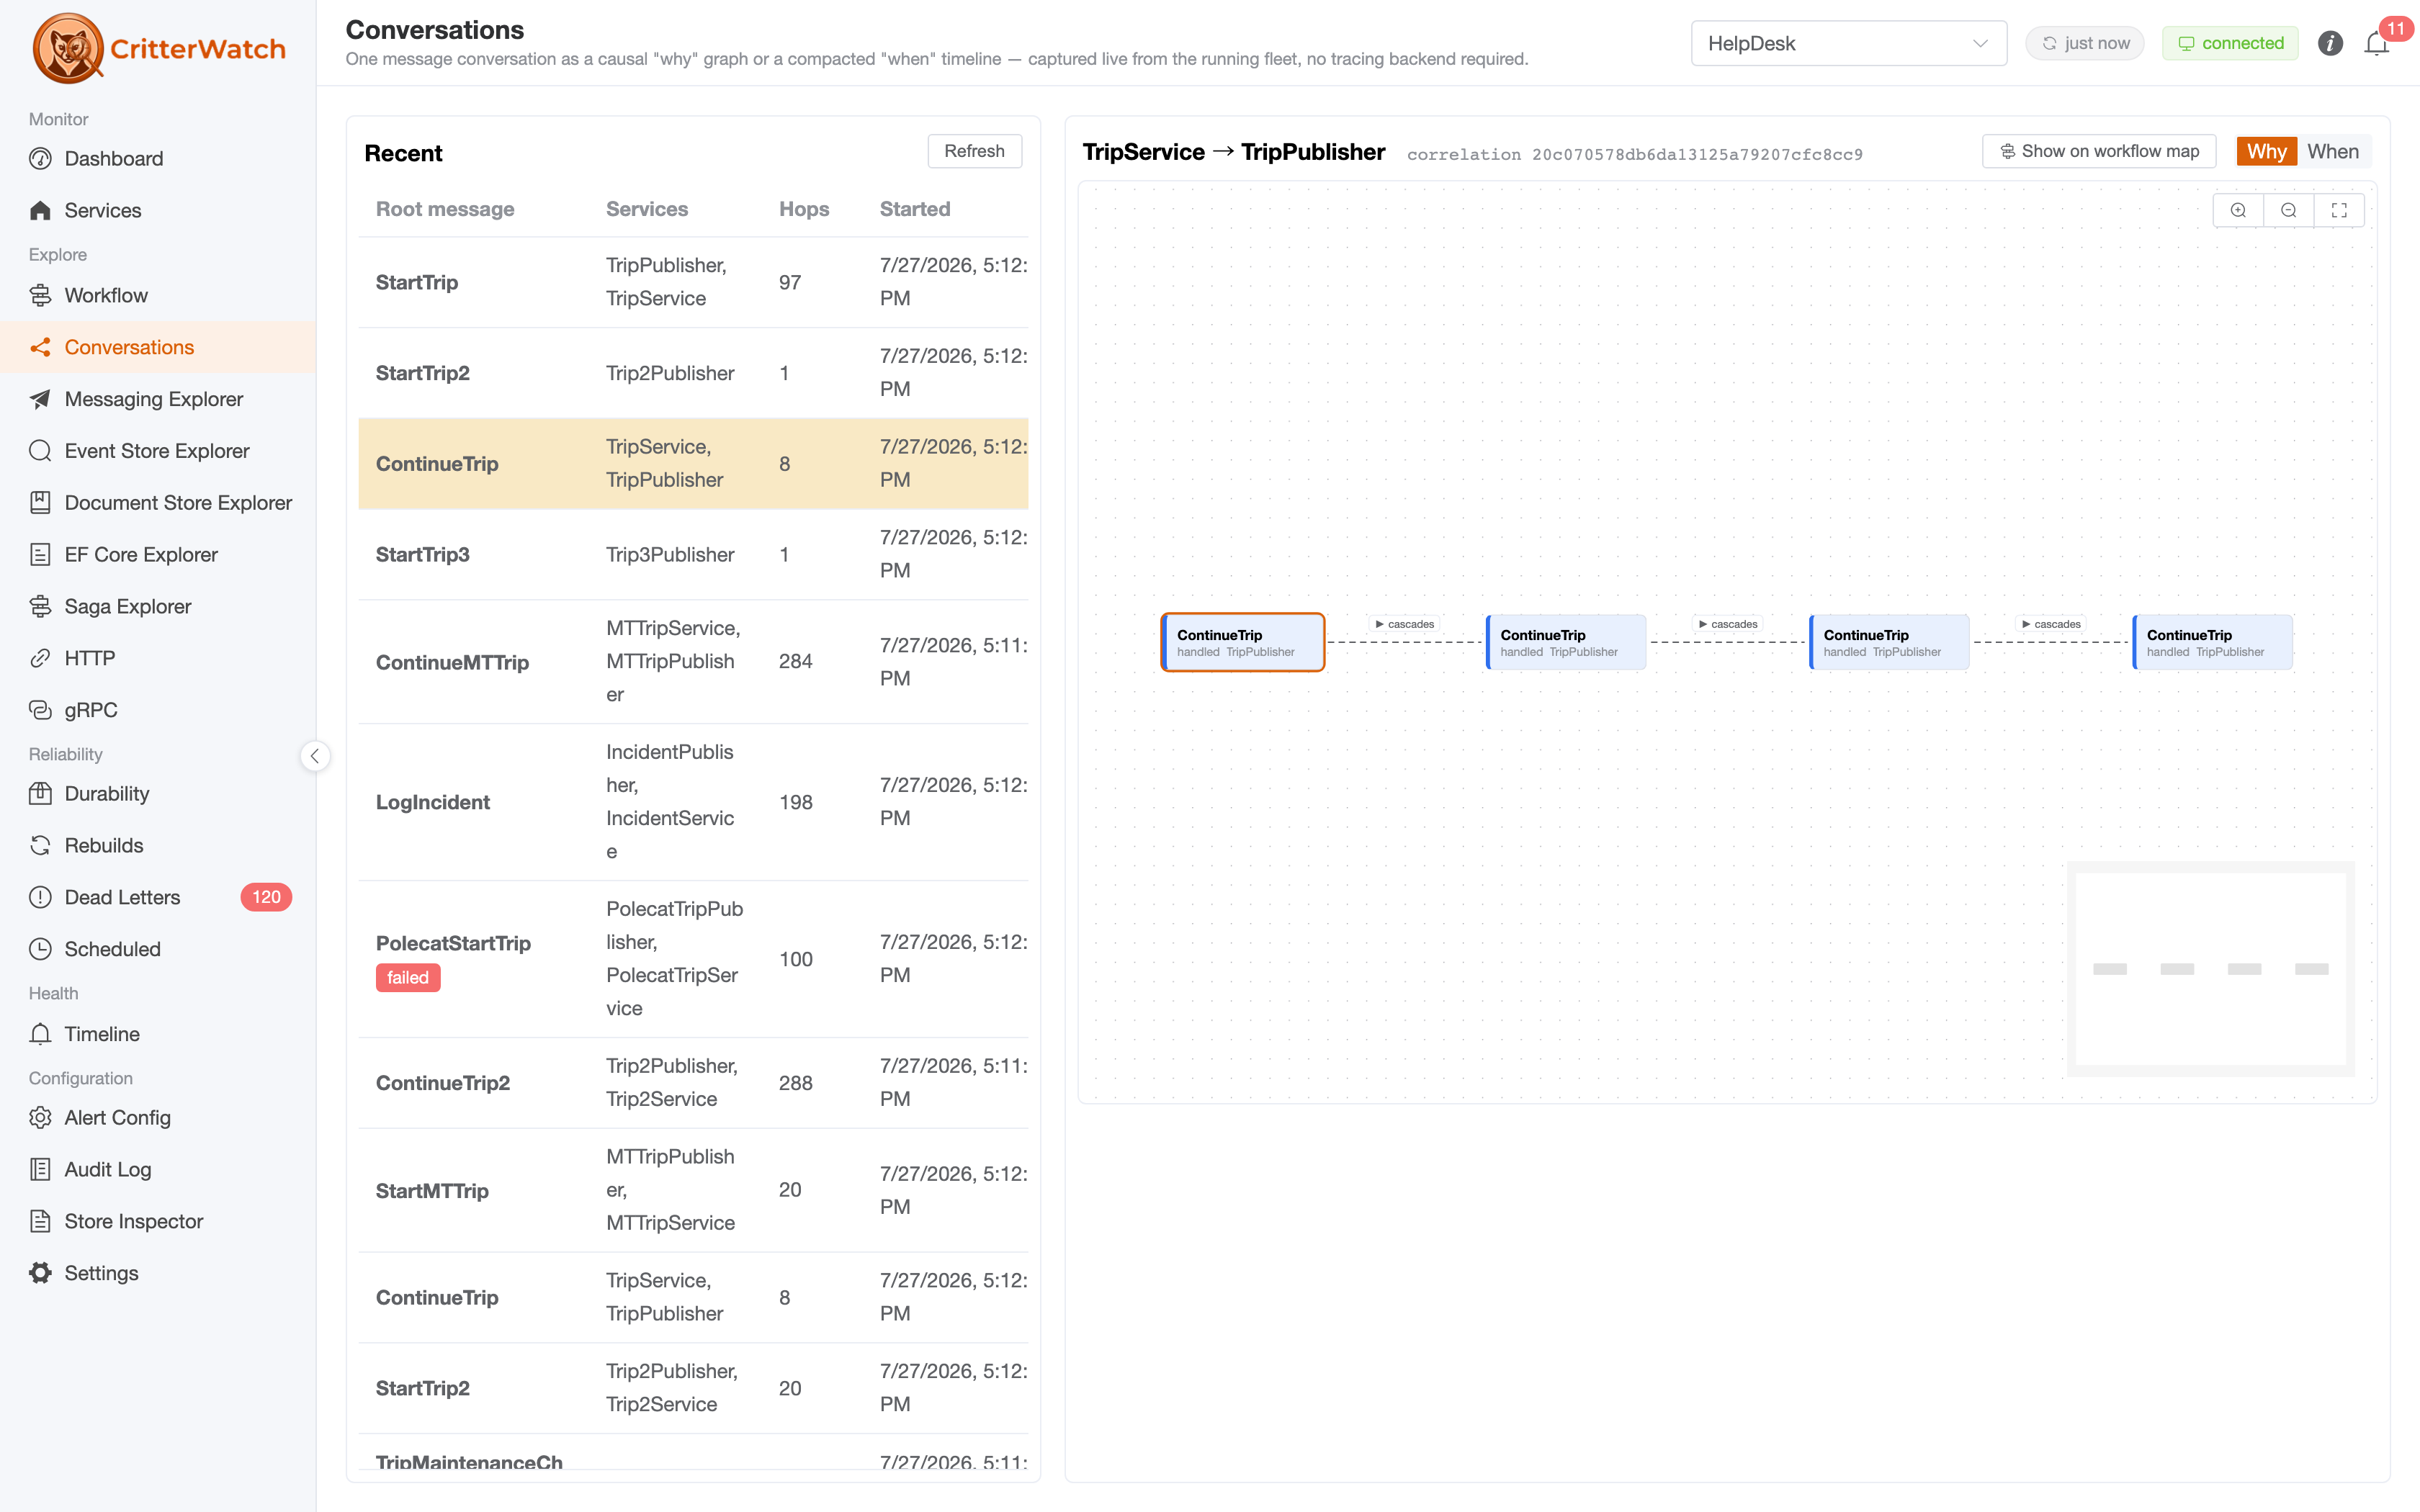
The graph views describe what the system can do. Conversations replays what it did do, for one concrete message instance: the real send → receive → execute → cascade chain, across service boundaries, with a Why view (the causal graph) and a When view (the compacted timeline). Failed messages can be recovered inline from the same screen.
The part worth calling out: this needs no tracing backend. CritterWatch captures the causality itself. Jaeger is still first-class if you run it — trace links are right there in the UI — but you get the causal graph on day one without standing anything else up.
And the rest of the shape
The same principle runs through the fine-grained screens: the HTTP chain detail page shows the actual generated code and OpenAPI metadata for a Wolverine route; the Endpoints and gRPC explorers enumerate the real listening and sending surface; the DDL viewer shows the exact schema the stack installed, with syntax highlighting, so "what tables does this thing create?" stops being a mystery.
2. Alerts and performance tracking
Generic infrastructure alerting will tell you a pod is unhealthy. It will not tell you that your TripAggregate projection stopped advancing forty minutes ago while the process stayed perfectly green. That gap is the reason CritterWatch has its own alert engine.
An alert taxonomy that knows what the Critter Stack is
Alerts are typed against Critter Stack concepts, not generic metrics:
| Family | Types |
|---|---|
| Throughput & latency | MetricsExecTime, MetricsThroughput, MetricsFailureRate |
| Projections | ProjectionLag, ProjectionStale, ProjectionPaused, ProjectionDeadLetters |
| High water mark | HighWaterStale, HighWaterAgentRestarted |
| Cluster & agents | AgentDown, agent churn |
| Transports | transport / broker health, CircuitBreaker, BackPressure |
Each one is seeded from baselines you can declare to AddCritterWatchMonitoring and then refined against observed history, so the thresholds start sane and get sharper rather than requiring you to guess a number in a YAML file on day one. Hysteresis is built in, so an alert that's flapping around its threshold doesn't page you eleven times.
Alerts have a lifecycle, not just an on/off
An alert is an event-sourced stream with a real state timeline: raised → elevated / reduced → acknowledged → snoozed → cleared or resolved. Acknowledging records who saw it without pretending it's fixed. Snoozing suppresses re-firing for a fixed window while leaving the underlying condition true. Every transition lands in the audit log against the ClaimsPrincipal from your host's auth layer.
Alert detail pages carry remediation actions — the alert doesn't just tell you a projection is lagging, it offers you the pause / restart / rebuild controls for that specific shard, and links to the slow message types behind a MetricsExecTime alert.
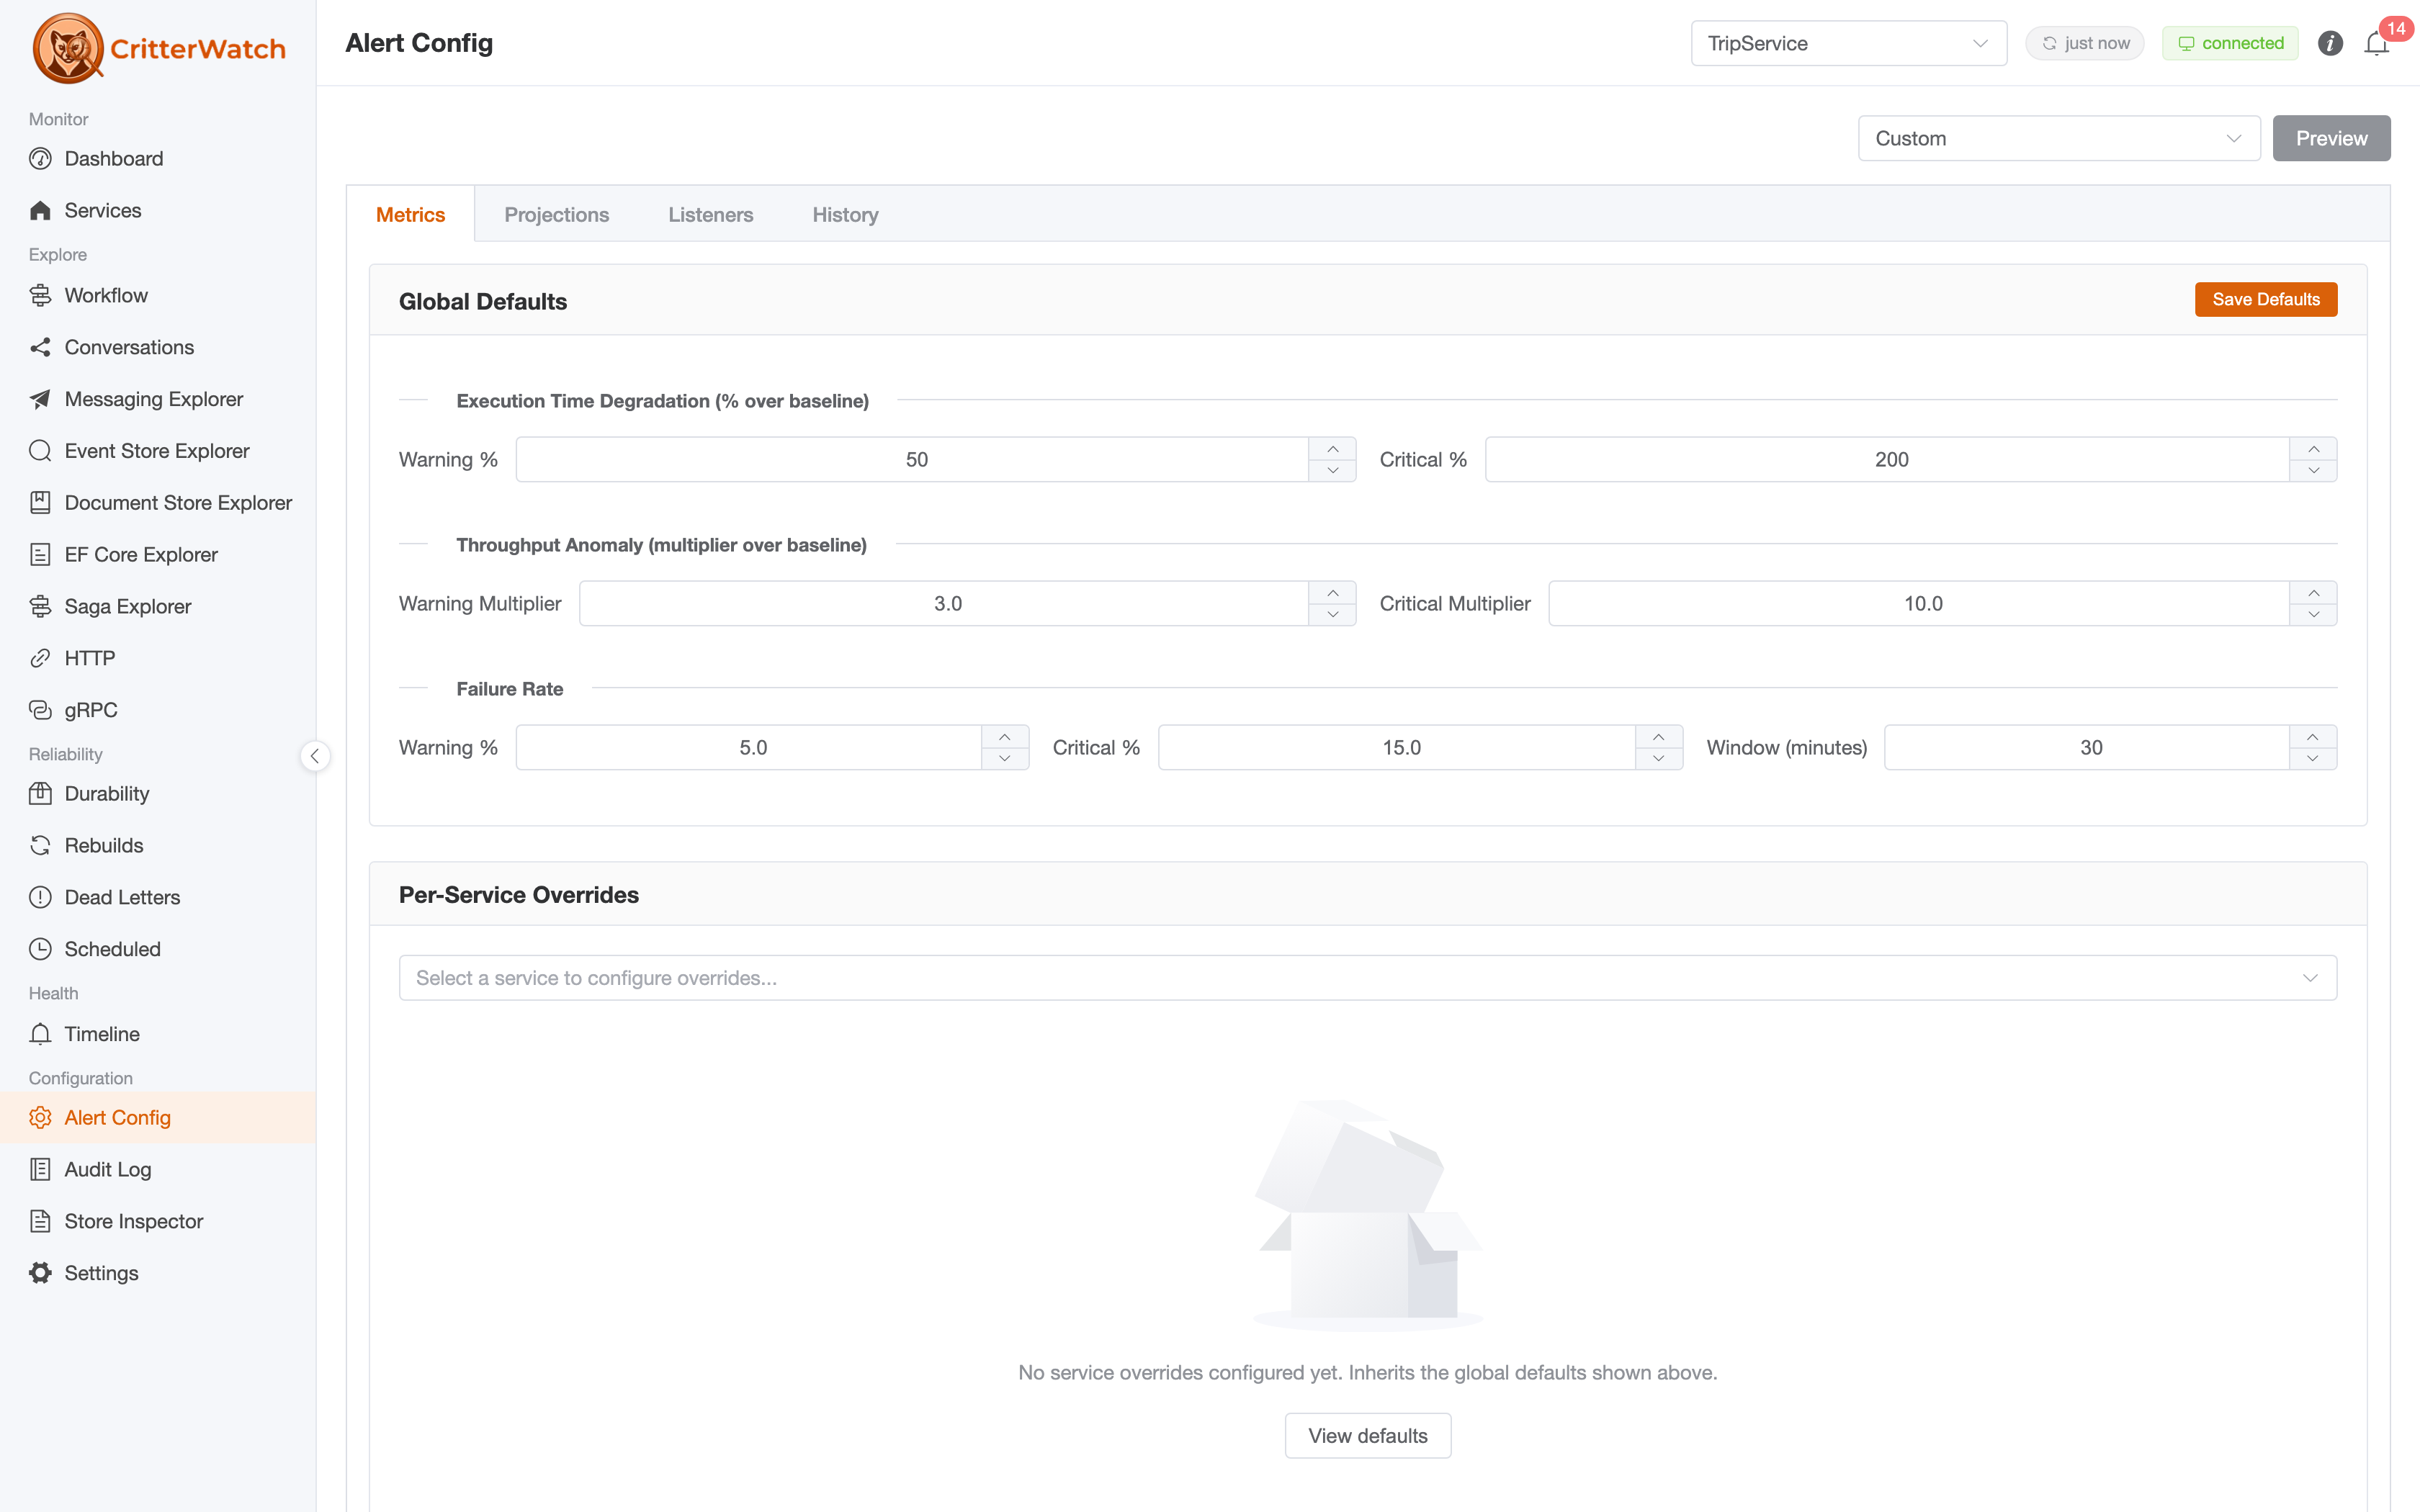
Thresholds are configurable globally and overridable per service, across metrics, projections, and listeners — with a history tab so a threshold change is itself an auditable event:
Performance tracking
Underneath the alerts is a persisted metrics history per service, per message type, per endpoint — execution time, throughput, failure rate — with configurable retention and a manual purge when a noisy service's history has outlived its usefulness. The Durability page rolls up the inbox / outbox / scheduled / dead-letter backlog per service and per message store, which is usually the fastest way to answer "where is work piling up?"
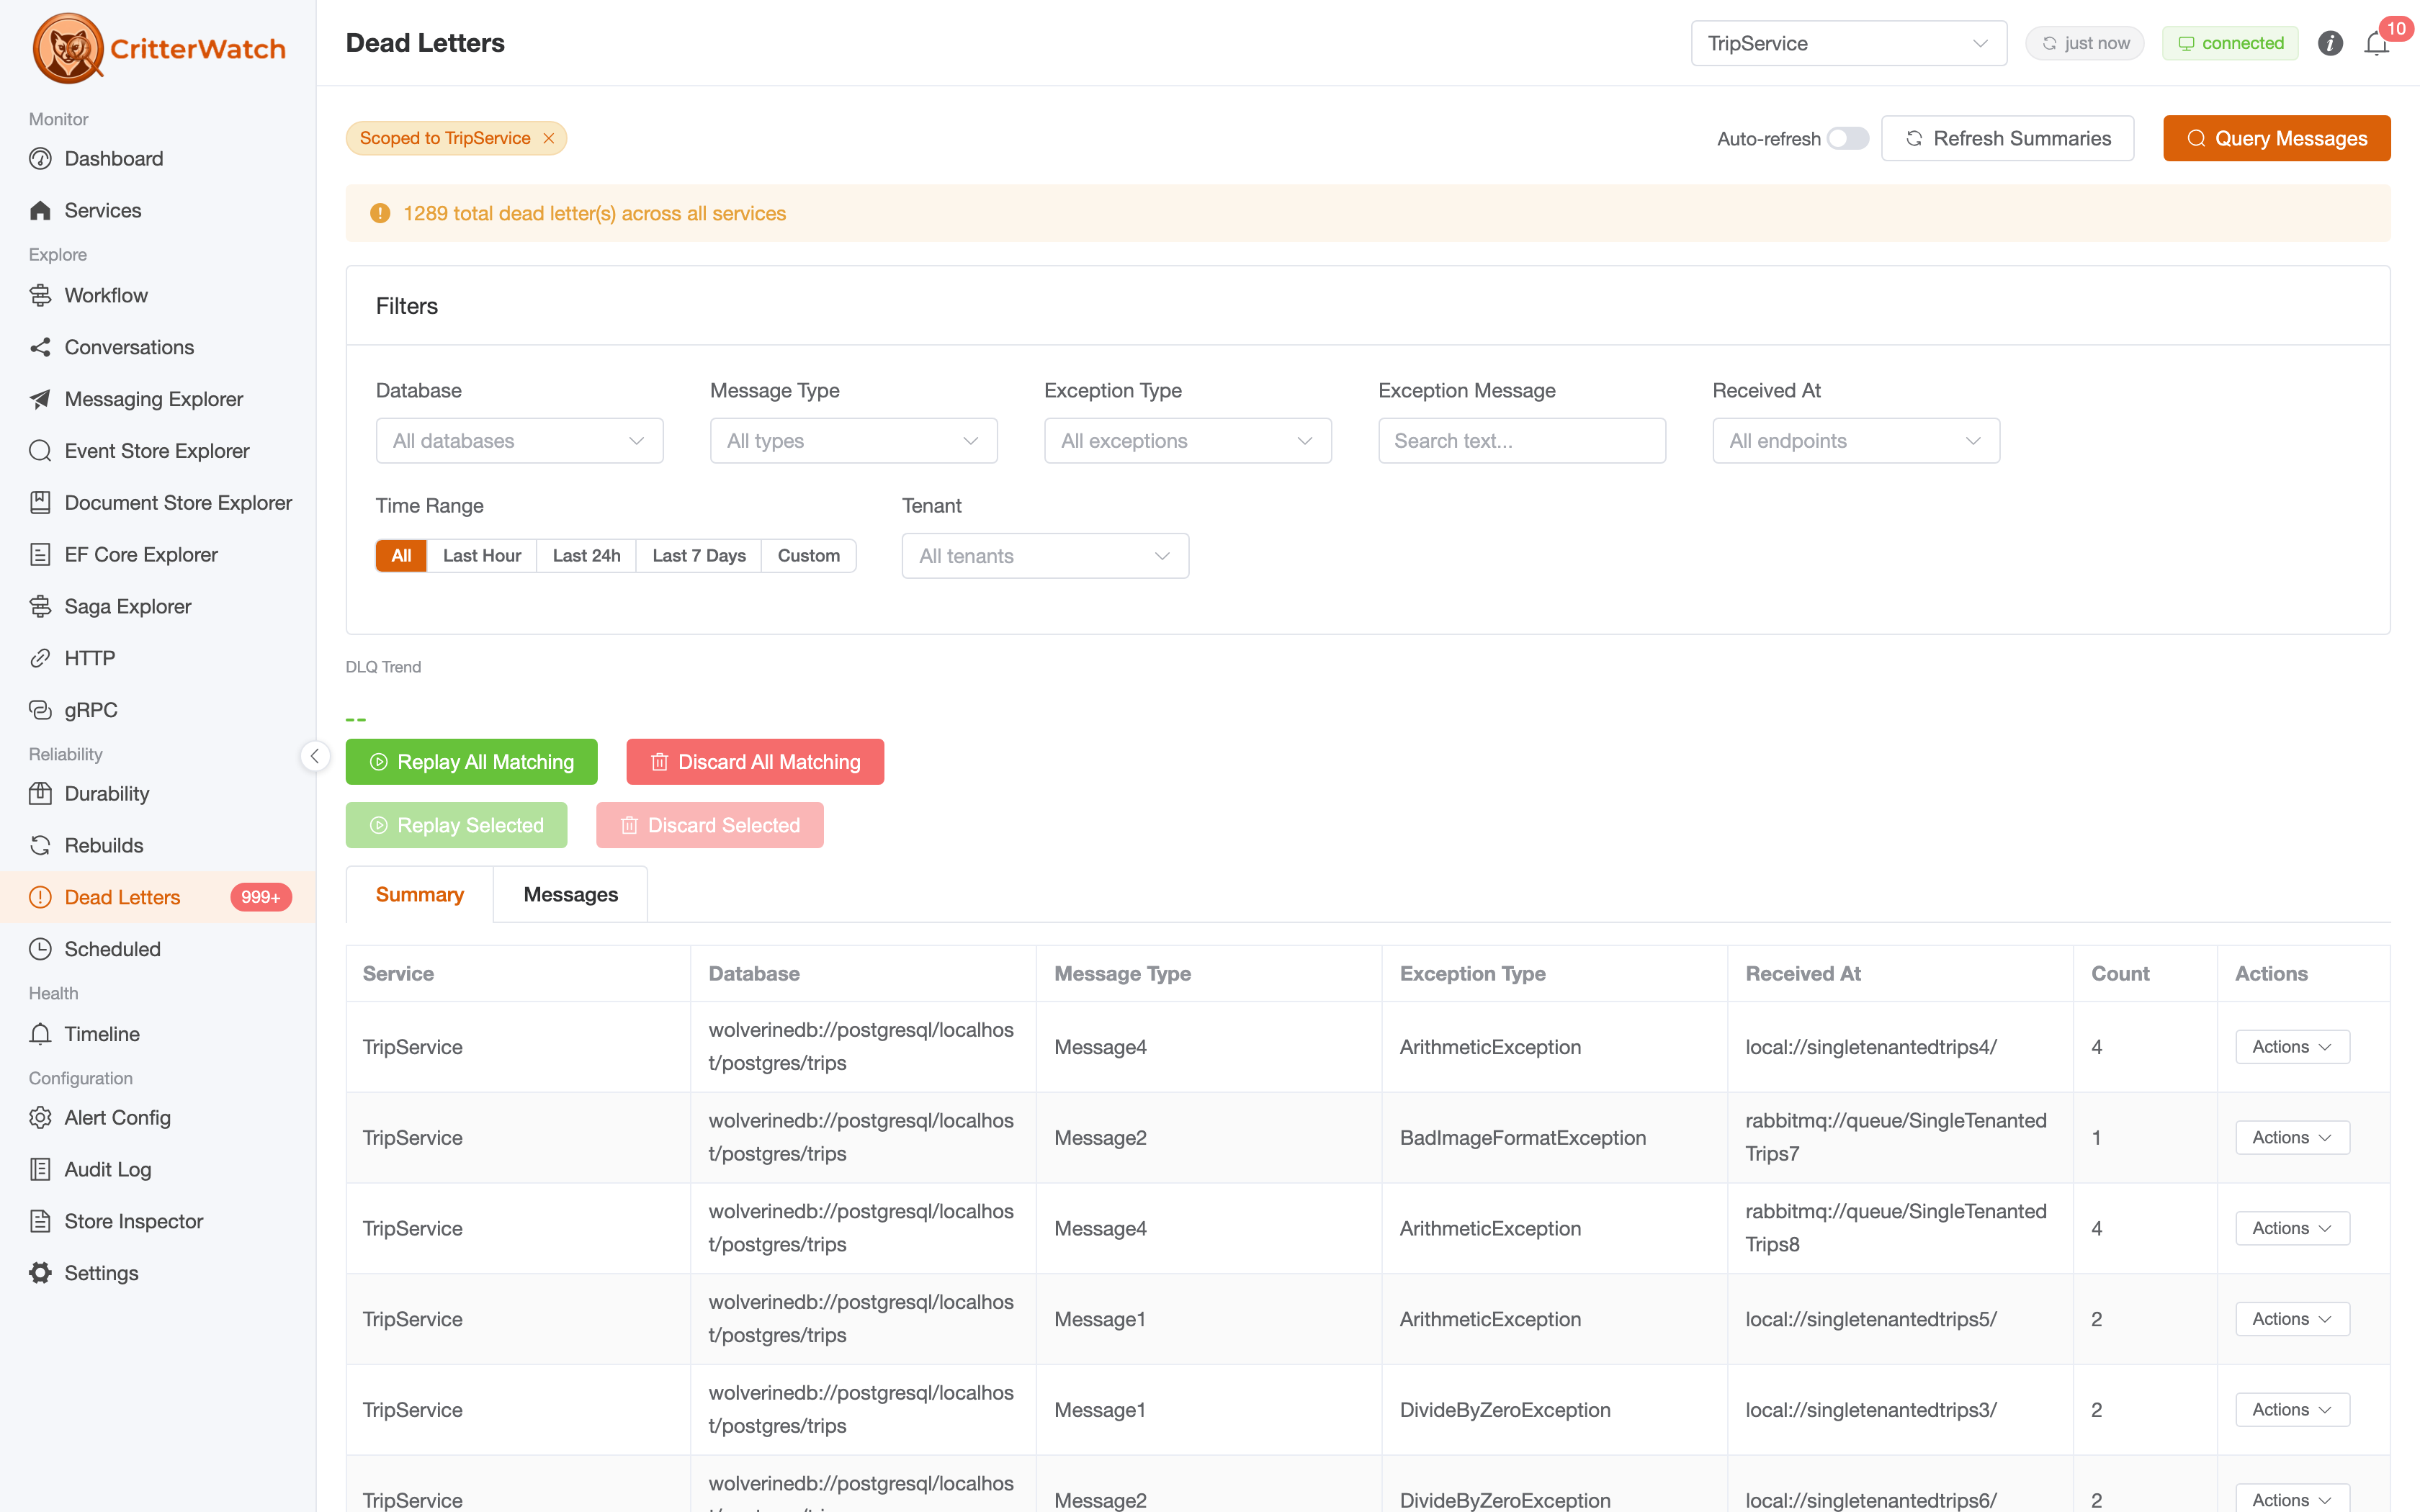
Dead letters get their own first-class surface: filter by database, message type, exception type, endpoint, time range, and tenant — then inspect the original envelope and replay or discard, individually, by selection, or across everything matching the current filter.
3. AI-assisted development and operations through MCP
CritterWatch ships 43 MCP tools across 15 tool groups, so an AI assistant — Claude Code, or anything else speaking MCP — can interrogate and operate your fleet through the same pipeline the console uses.
We think this is the most interesting thing in the release, because a monitoring console has exactly the data an assistant is usually missing. Your assistant can read your code. What it cannot normally do is find out what that code is doing in an environment right now. These tools close that loop.
The questions this actually answers
The tools split into read/diagnostic and action/mutating groups. Here's the kind of thing they make answerable, phrased the way you'd actually ask:
"What's wrong right now?" — SummarizeActiveAlerts gives a per-service, per-severity rollup; SummarizeClusterHealth counts services, online versus stale nodes, and per-broker/per-endpoint health; ListDegradedSurfaces names exactly which endpoints and brokers aren't Healthy. An assistant can open with the rollup and drill in, instead of dumping the whole fleet's state into its context.
"Why is this slow, and where is work piling up?" — ListBacklogHotspots finds services whose combined inbox + outbox + scheduled + dead-letter backlog crosses a threshold; GetBacklogState breaks one service down; GetProjectionLag returns every shard's current sequence, when it last advanced, its agent status, and any error. That's enough for an assistant to distinguish "a projection is stalled" from "the transport is backed up" without you narrating it.
"Where does this message go, and why does it go there?" — this is the one we most enjoy. ExplainMessageRouting runs Wolverine's own ExplainRoutingFor live against the monitored service and returns the ordered route-source chain: every source consulted, what each produced, and which one terminated the decision. When someone asks "why is OrderPlaced going to that queue," the answer is a derivation, not a guess about which convention won. ListMessageRouting does the same across an entire service.
"Where does this type fit in the workflow?" — DescribeLifecycle returns a type's complete lifecycle across all monitored services as a Mermaid sequence diagram. An assistant onboarding onto an unfamiliar flow can ask for the shape and get something it can reason about and paste into a PR description.
"What does the data actually look like?" — ListDocumentTypes enumerates queryable document types live from a service, QueryDocuments pages through them as raw JSON, and GetDocument fetches one by id. Debugging a projection against real stored state, without hand-writing a Marten query in a scratch console.
"Show me what happened on this trace." — the trace tools query your OpenTelemetry provider by service and tag filters, and fetch a full trace by id.
"Now go fix it." — the action tools are the operator surface: acknowledge / snooze / clear alerts; replay or discard dead letters; pause / restart / drain listeners; pause / restart / rebuild / eject projections; add / enable / disable / remove tenants; and drive the ChaosMonkey (failure rate, projection failure rate, artificial handler delay) for game days and reproduction work.
That last one is worth dwelling on for development. "Reproduce the back-pressure condition, then tell me what the alert engine did" is a request an assistant can now carry out end to end — set a slow-handler delay, watch GetBacklogState climb, read the resulting alert, and clear the chaos when it's done.
Every tool is gated
There is no free MCP tier and no ungated tool. Read and diagnostic tools check the license first and return a structured "license missing" envelope otherwise. Action tools go through an authorization context that runs the license check before an RBAC capability check, so a mutating call has to clear both. If you've enabled RBAC (AddCritterWatchAuthorization<TAuthorizer>()), capabilities are scoped per service — and per tenant, where the resource string is {serviceName}:{tenantId}. Every action lands in the audit log.
We would rather ship this conservatively than discover that somebody's coding assistant hard-deleted a tenant database because it was being helpful.
4. Event store management
If you're running Marten or Polecat, the async daemon is the part of the system most likely to be quietly wrong. CritterWatch treats it as a first-class operational surface.
Projections and shards
The Projections grid shows every projection shard across every monitored service with color-coded state and stall detection — a shard that has stopped advancing is called out rather than left for you to notice. Projection detail adds a sequence chart (progression over time against the high water mark), the alert history for that shard, and the controls.
Those controls are pause / restart / rebuild / rewind, and every one of them is tenant-scopable. Multi-tenant projections were the awkward case in every earlier release; per-tenant fan-out is now proven end to end, so you can rebuild one tenant's projection without touching the other four hundred.
One deployment note that bites people: pause and restart are leader-owned agent-assignment changes. Under
DurabilityMode.Solothere's no leader and no agent distribution, so those commands no-op. Setopts.Durability.Mode = DurabilityMode.Balancedon monitored services — a single Balanced node elects itself leader and runs every agent locally, so this costs nothing even for single-node deployments. Read-only monitoring, rebuild, and rewind work in any mode.
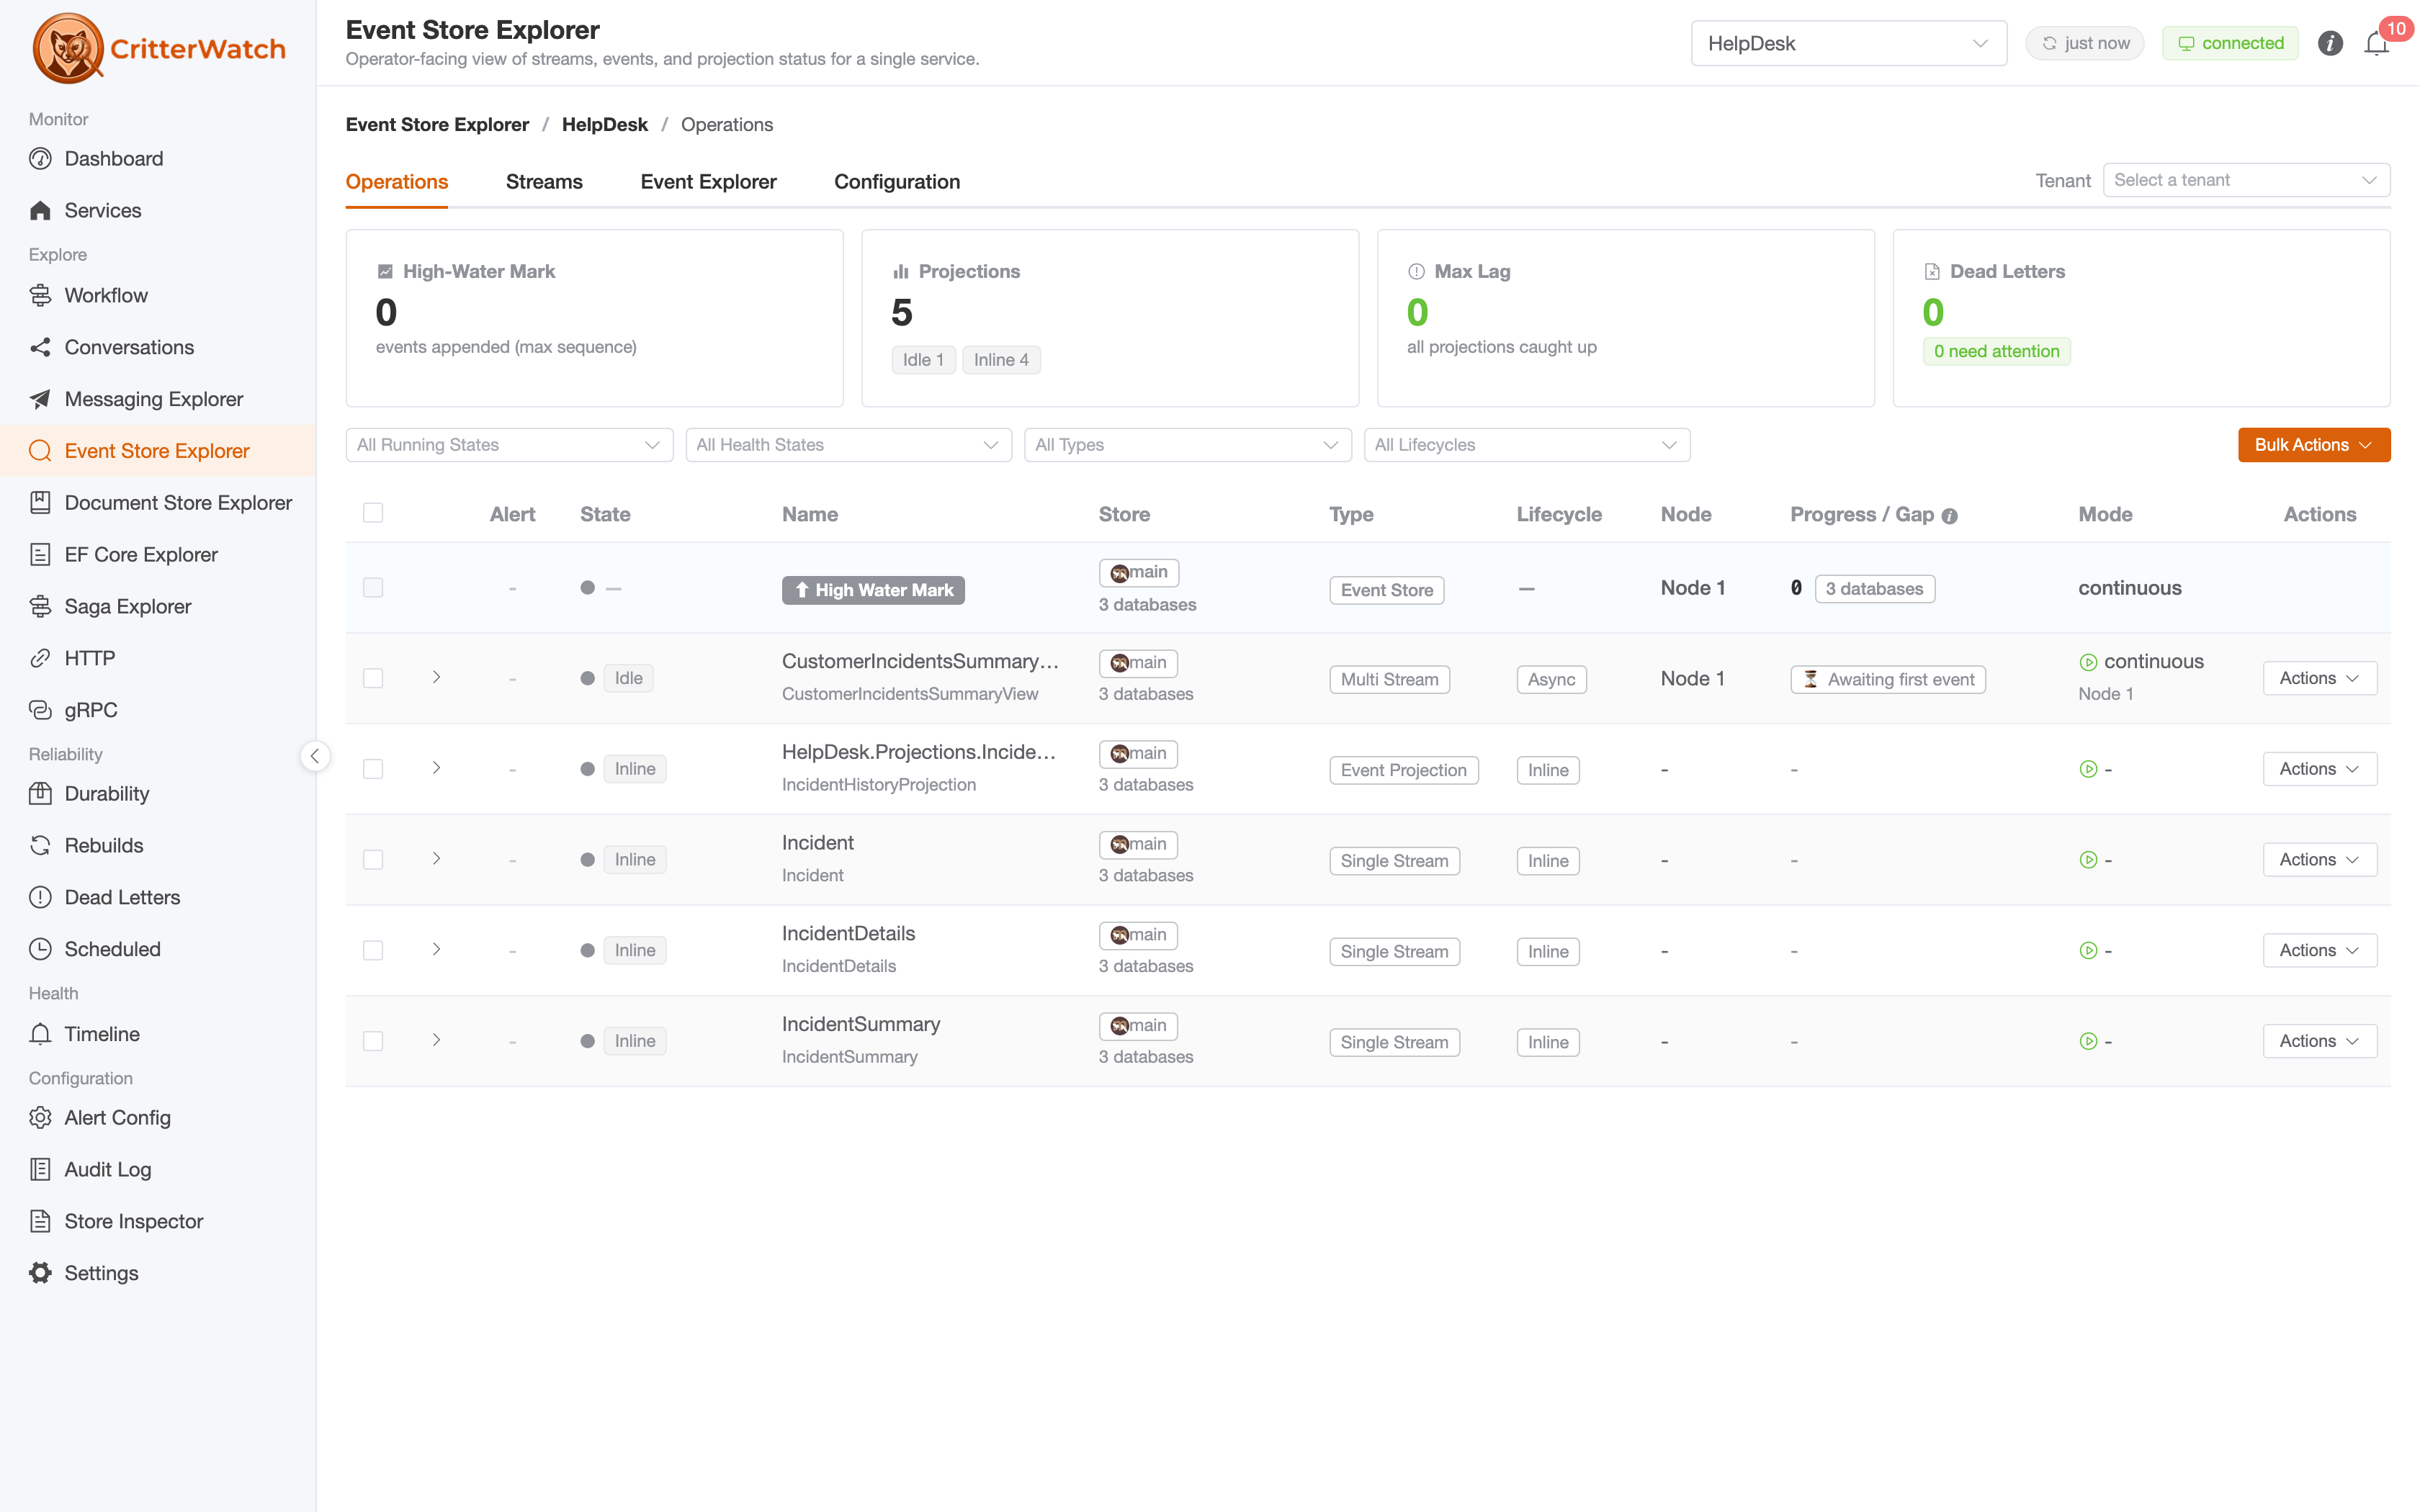
Every row carries its store, its type (single-stream, multi-stream, event projection), its lifecycle (inline vs. async), which node currently owns it, and its progress against the high water mark — with the row actions and a bulk-action menu for driving several at once.
Rebuilds are orchestrated, not fire-and-forget
Kicking off a rebuild used to be a hopeful act. In 1.0 there's a real orchestration engine behind it: rebuilds run as tracked batches with progress, retry, cancel, and auto-resume if a node goes away mid-rebuild. The Rebuilds page lists batches with their state; batch detail shows per-shard progress and failure counts. Polecat has parity with Marten here.
Orphaned progression rows
Rename or version a projection and you leave behind a progression row nothing owns — it shows up forever as a shard that never advances, and it makes every "is anything stalled?" check lie to you. CritterWatch detects these, surfaces them as Orphaned, and gives you an eject action to delete the row. Shard identities are composed and parsed through JasperFx's ShardName throughout, so versioned and per-tenant shards resolve correctly rather than being mangled by string concatenation.
The Event Store Explorer
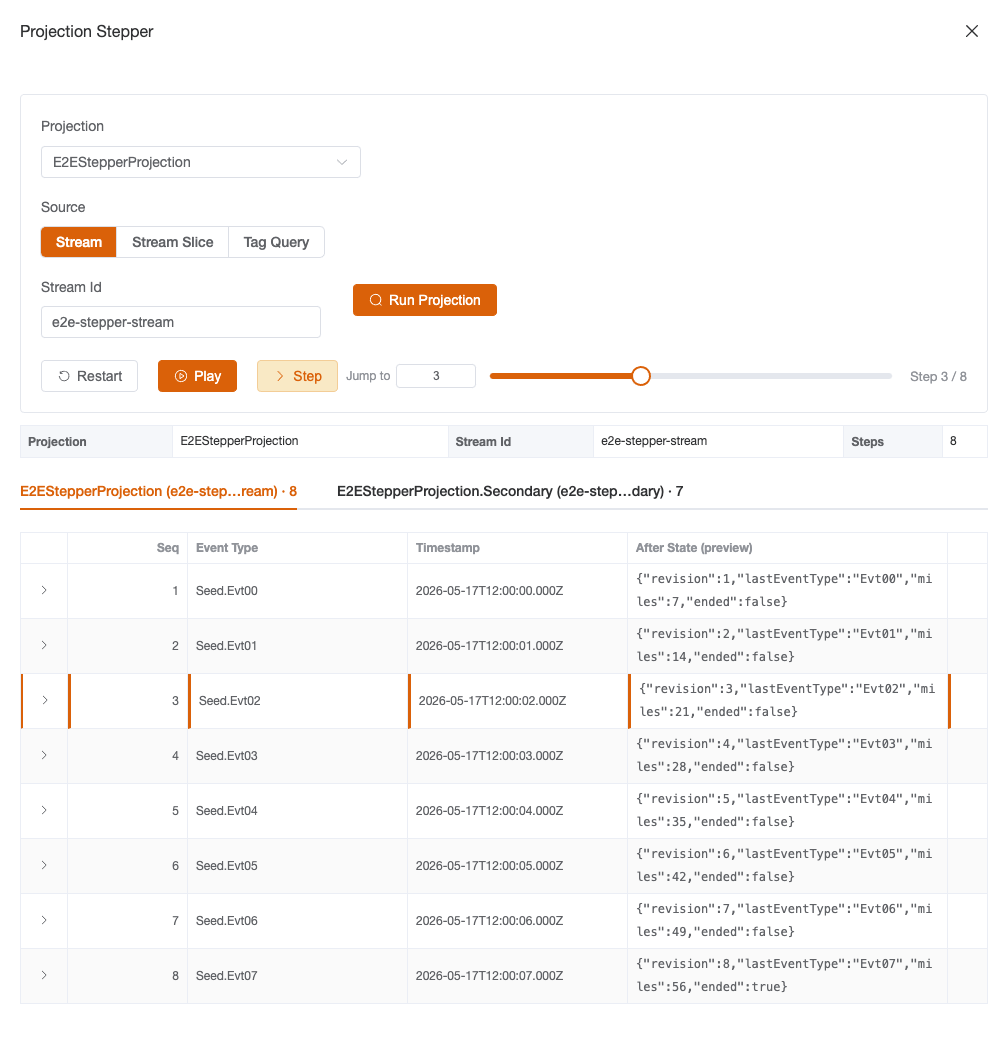
The Event Store Explorer is the read side: browse events, inspect streams, and see the store's structure — opt-in per service, since it reads live event data (the option defaults on in Development and off everywhere else). The Operations tab shown above is one of its four; it's also where the Projection Stepper lives.
The Stepper is the tool you want the moment somebody says "I think that projection is computing the wrong thing." Pick a projection, pick a slice of events (a stream, a stream slice, or a DCB tag query), and step through it one event at a time — play, pause, jump to N, scrub — watching the after-state of the aggregate change event by event until you see the one that's wrong.
And the document side
Alongside the event store, the Document Store Explorer and EF Core Explorer cover the non-event-sourced half of most real systems, and the Store Inspector exposes the raw stores plus recent SignalR traffic for when you're debugging CritterWatch's own view of the world.
Getting started
Two packages. In each monitored service:
dotnet add package Wolverine.CritterWatch --version 1.0.0-RC.1And for the console host:
dotnet add package CritterWatch --version 1.0.0-RC.1The console needs PostgreSQL 14+ with Marten 9+ for its own storage, and every monitored service (and the console) runs on Wolverine 6+. Services talk to the console over a Wolverine transport — RabbitMQ, AWS SQS, Azure Service Bus — or over the broker-less HTTP / gRPC channel if you'd rather not stand up a broker at all. Full walkthroughs live in the installation guide.
If you only use Marten today, you'll need to add Wolverine for the CritterWatch communication channel — but that doesn't mean you have to use Wolverine for anything else in your system.
For high availability, run multiple CritterWatch instances behind a load balancer. The only piece needing cross-instance coordination is SignalR; give it a backplane (Redis is the common choice) and it clusters cleanly.
What's between here and 1.0
Being a release candidate, the bar for the remaining window is bug fixes and documentation rather than new surface area. Two items are still in flight:
- SQL Server persistence for CritterWatch's own storage, via Polecat — so the requirement becomes "PostgreSQL/Marten or SQL Server/Polecat." The monitored services have supported both for a while; this is about the console itself.
- Declared-versus-implemented drift detection on the Event Model swim-lane — comparing what a service declares in an
EventModelDefinitionagainst what it actually implements, and flagging handlers you built but never declared, or declared steps with no handler behind them. The rendering scaffold is in; the comparison isn't wired to the live assembler model yet.
If you run a Critter Stack system, please take RC 1 for a spin and tell us what breaks. File it in ProductSupport or bring it to #CritterWatch in the Critter Stack Discord — and support customers can always reach us directly.