
JasperFx works with teams running Marten, Polecat, and Wolverine at every size, including a few that have pushed this exact feature much harder than we ever expected. If you want help getting an event sourced system to behave in production, that's what we do.
Asynchronous projections can be a significant scalability and production support concern if you're doing Event Sourcing on any kind of high volume system. Keeping fifteen or twenty read models continuously up to date in the background, across a cluster where nodes come and go, without anybody having to babysit them is the part that separates a nice demo from a resilient production system.
I've had several discussions with JasperFx clients lately where I've recommended this feature, so writing this post seemed timely.
JasperFx and the Critter Stack have been around a while now and have been used in some challenging systems, and I think we've ended up with the most robust answer available for Event Sourcing on .NET today:
- Marten (or Polecat if you're a SQL Server shop) runs the projections
- Wolverine decides which node runs which projection, and moves the work around as the cluster changes
- CritterWatch shows you what's happening, lets you intervene, and watches the whole thing for a much longer list of problems than the open source tools can see on their own -- and because this is 2026, also provides MCP endpoints over both the monitoring and management actions to let your LLM tools get in on the fun too!
The problem with stateful background work
A Marten projection running asynchronously is a stateful process. It reads events in order, keeps track of how far it's gotten, and writes its read model changes and its progress together. Two copies of the same projection running at once would be stepping all over each other, so every projection "shard" has to run on exactly one node at a time. The same goes for event subscriptions.
That simple rule creates a few big questions for a clustered application:
- Who decides which node runs which projection?
- What happens when that node goes away? Or when three of them go away at once during a deployment?
- How do you keep one unlucky node from ending up with all the work while its neighbors sit idle?
- How do you deploy a new version of a projection without taking the old one down first?
- How do you even know any of this is working?
In the early days of Marten our answer was "Hot/Cold". One node won a database advisory lock and ran every single projection, and the other nodes stood by in case the hot one died. That's better than nothing, but to put it mildly, running all of your background work on one node isn't a scalability story.
The reliance on advisory locks for load distribution in Marten has also been vulnerable to the kind of connectivity hiccups that come from database maintenance or random Kubernetes scale up or scale down activities. The Wolverine distribution model is much more robust and better able to course correct than our Marten-only distribution.
Letting Wolverine manage it
I first wrote about this back when it landed in Wolverine 3.0. With one line of configuration, Wolverine takes over the assignment of Marten's projection and subscription work:
builder.Services.AddMarten(opts =>
    {
        opts.Connection(connectionString);

        opts.Projections.Add<TripProjection>(ProjectionLifecycle.Async);
        opts.Projections.Add<DayProjection>(ProjectionLifecycle.Async);
        opts.Projections.Add<DistanceProjection>(ProjectionLifecycle.Async);
    })
    .IntegrateWithWolverine(m =>
    {
        // Wolverine spreads the projections and subscriptions
        // across the running cluster. This replaces AddAsyncDaemon()
        m.UseWolverineManagedEventSubscriptionDistribution = true;
    });
And now your cluster looks more like this:
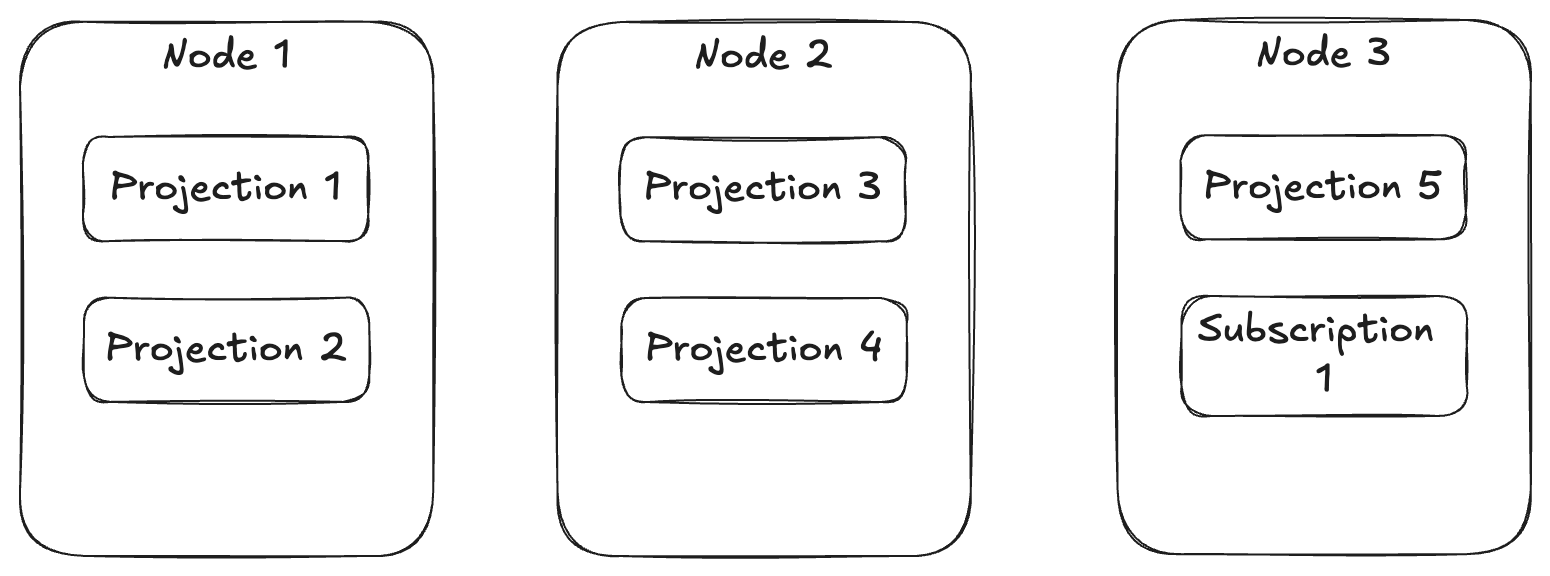
Under the covers, that's Wolverine's leader election and agent assignment subsystem. Every node heartbeats into your Wolverine message store, one node holds the leadership lock, and the leader continuously compares what should be running against what is running and sends start, stop, and reassign commands to the other nodes. Each projection shard is an "agent" as far as Wolverine is concerned.

An accurate depiction of leader election.
What you get from that one line:
- Every projection and subscription is running on exactly one node
- If a node drops out, its work is restarted on the surviving nodes without anybody getting paged
- When new nodes come online, the leader rebalances
- The same thing works for Polecat, and for ancillary stores in a modular monolith
- There's no extra infrastructure to stand up. No separate coordination service, no lease container, no cluster manager. It rides on the database you already have, and uses per-node control queues on Rabbit MQ or Azure Service Bus if you happen to be using one of those
The details are in the distribution documentation.
"Fair" by default
For a system with a single event store database, the leader's goal is simple fairness: spread the agents evenly across the nodes by count. Five projections and a subscription on three nodes is two apiece. Add a fourth node and the leader will deliberately stop a couple of agents and start them on the new node, because a cluster where the newest pod does nothing isn't actually scaled out.
Even is a great default, but agents don't all cost the same. One projection might be a trivial counter while another is a monster multi-stream aggregation. If "even by count" leaves one node living in garbage collection while the others idle, you can opt into capacity-aware assignment, where every node reports how loaded it is with each heartbeat and the leader takes that into account:
builder.Host.UseWolverine(opts =>
{
    opts.Durability.CapacityAwareAssignment = true;

    // You tell Wolverine what "load" means for your system.
    // This one ships in the box and reads memory pressure
    // against the container's memory limit
    opts.Durability.NodeLoadMonitor = new MemoryPressureLoadMonitor();
});
A node over the line stops receiving new agents and starts shedding a little work at a time, but only if another node can actually take it. A struggling node is still better than no node at all. And if every node is over the line, the leader leaves agents unassigned rather than tipping over a node that's already in trouble. That behavior came straight out of a real incident where three nodes shrank to one and the survivor dutifully accepted every assignment until it ran out of memory.
Database affinity for multi-tenanted systems
At really any kind of scale, you have to start being cognizant of database connection usage to avoid exhausting your connection pools. That's been one of many technical challenges the Critter Stack has faced over the years, and this database affinity feature is one of the things we've done to try to reduce connection usage overall.
Fairness by agent count is exactly the wrong thing to do for a multi-tenanted system that uses a database per tenant, or Marten's sharded multi-tenancy where many tenants are pooled into a set of databases.
Here's why. Say you have 500 tenant databases, 20 projections, and 6 nodes. Spread those 10,000 agents evenly and purely by count, and every node ends up running a few projections against nearly every database. Every node opens a connection pool to nearly every database, the pool count grows as nodes × databases, and you find out what PostgreSQL's max_connections setting is the hard way.
So for any event store that's backed by more than one database, Wolverine switches to database affinity without you configuring anything. All of the agents for one database are kept together on one node, and the databases are what get spread fairly across the cluster, largest group first so the total agent counts still come out balanced. A node only opens pools to the databases it owns.
It gets more interesting with per-tenant event partitioning, where each tenant gets its own event sequence and its own projection progress inside a shared database:
builder.Services.AddMarten(opts =>
    {
        opts.Events.TenancyStyle = TenancyStyle.Conjoined;

        // Every tenant gets its own event sequence, its own high
        // water mark, and its own projection progress
        opts.Events.UseTenantPartitionedEvents = true;
    })
    .IntegrateWithWolverine(m =>
    {
        m.UseWolverineManagedEventSubscriptionDistribution = true;
    });
Now a slow or enormous tenant can't hold back the projections for everybody else, and you can rebuild one tenant's read models without touching the rest. The price is that the agent count is now one per projection per tenant. One JasperFx client runs a little over 2,100 tenants across 512 databases with 22 projections, which works out to roughly 52,000 agents. Database affinity still applies. Every one of a database's tenant agents stays together on one node, and within that node the tenants take turns under a shared memory budget so that a rebuild can't load more than the pod can hold.
And when capacity-aware assignment needs to relieve an overloaded node in this model, it moves a whole database's worth of agents at once. It never splits a database across nodes to shave off a little load.
What "robust" took
I don't want to wave my hands at the word "robust", so here's what's behind it. We've written about the last few months of this work already:
- Wolverine's Agent Assignment at Scale is the war story. At 512 databases and tens of thousands of agents we found every place where the leader could make a confident decision from stale information and trigger a wave of thousands of pointless stops and starts. The fixes were mostly about teaching the leader to be reluctant in the right places: several consecutive stale readings before a node gets ejected, a new leader holding back for one evaluation so it doesn't double-start what its predecessor had in flight, a cold cluster waiting a beat so the first pod doesn't grab everything
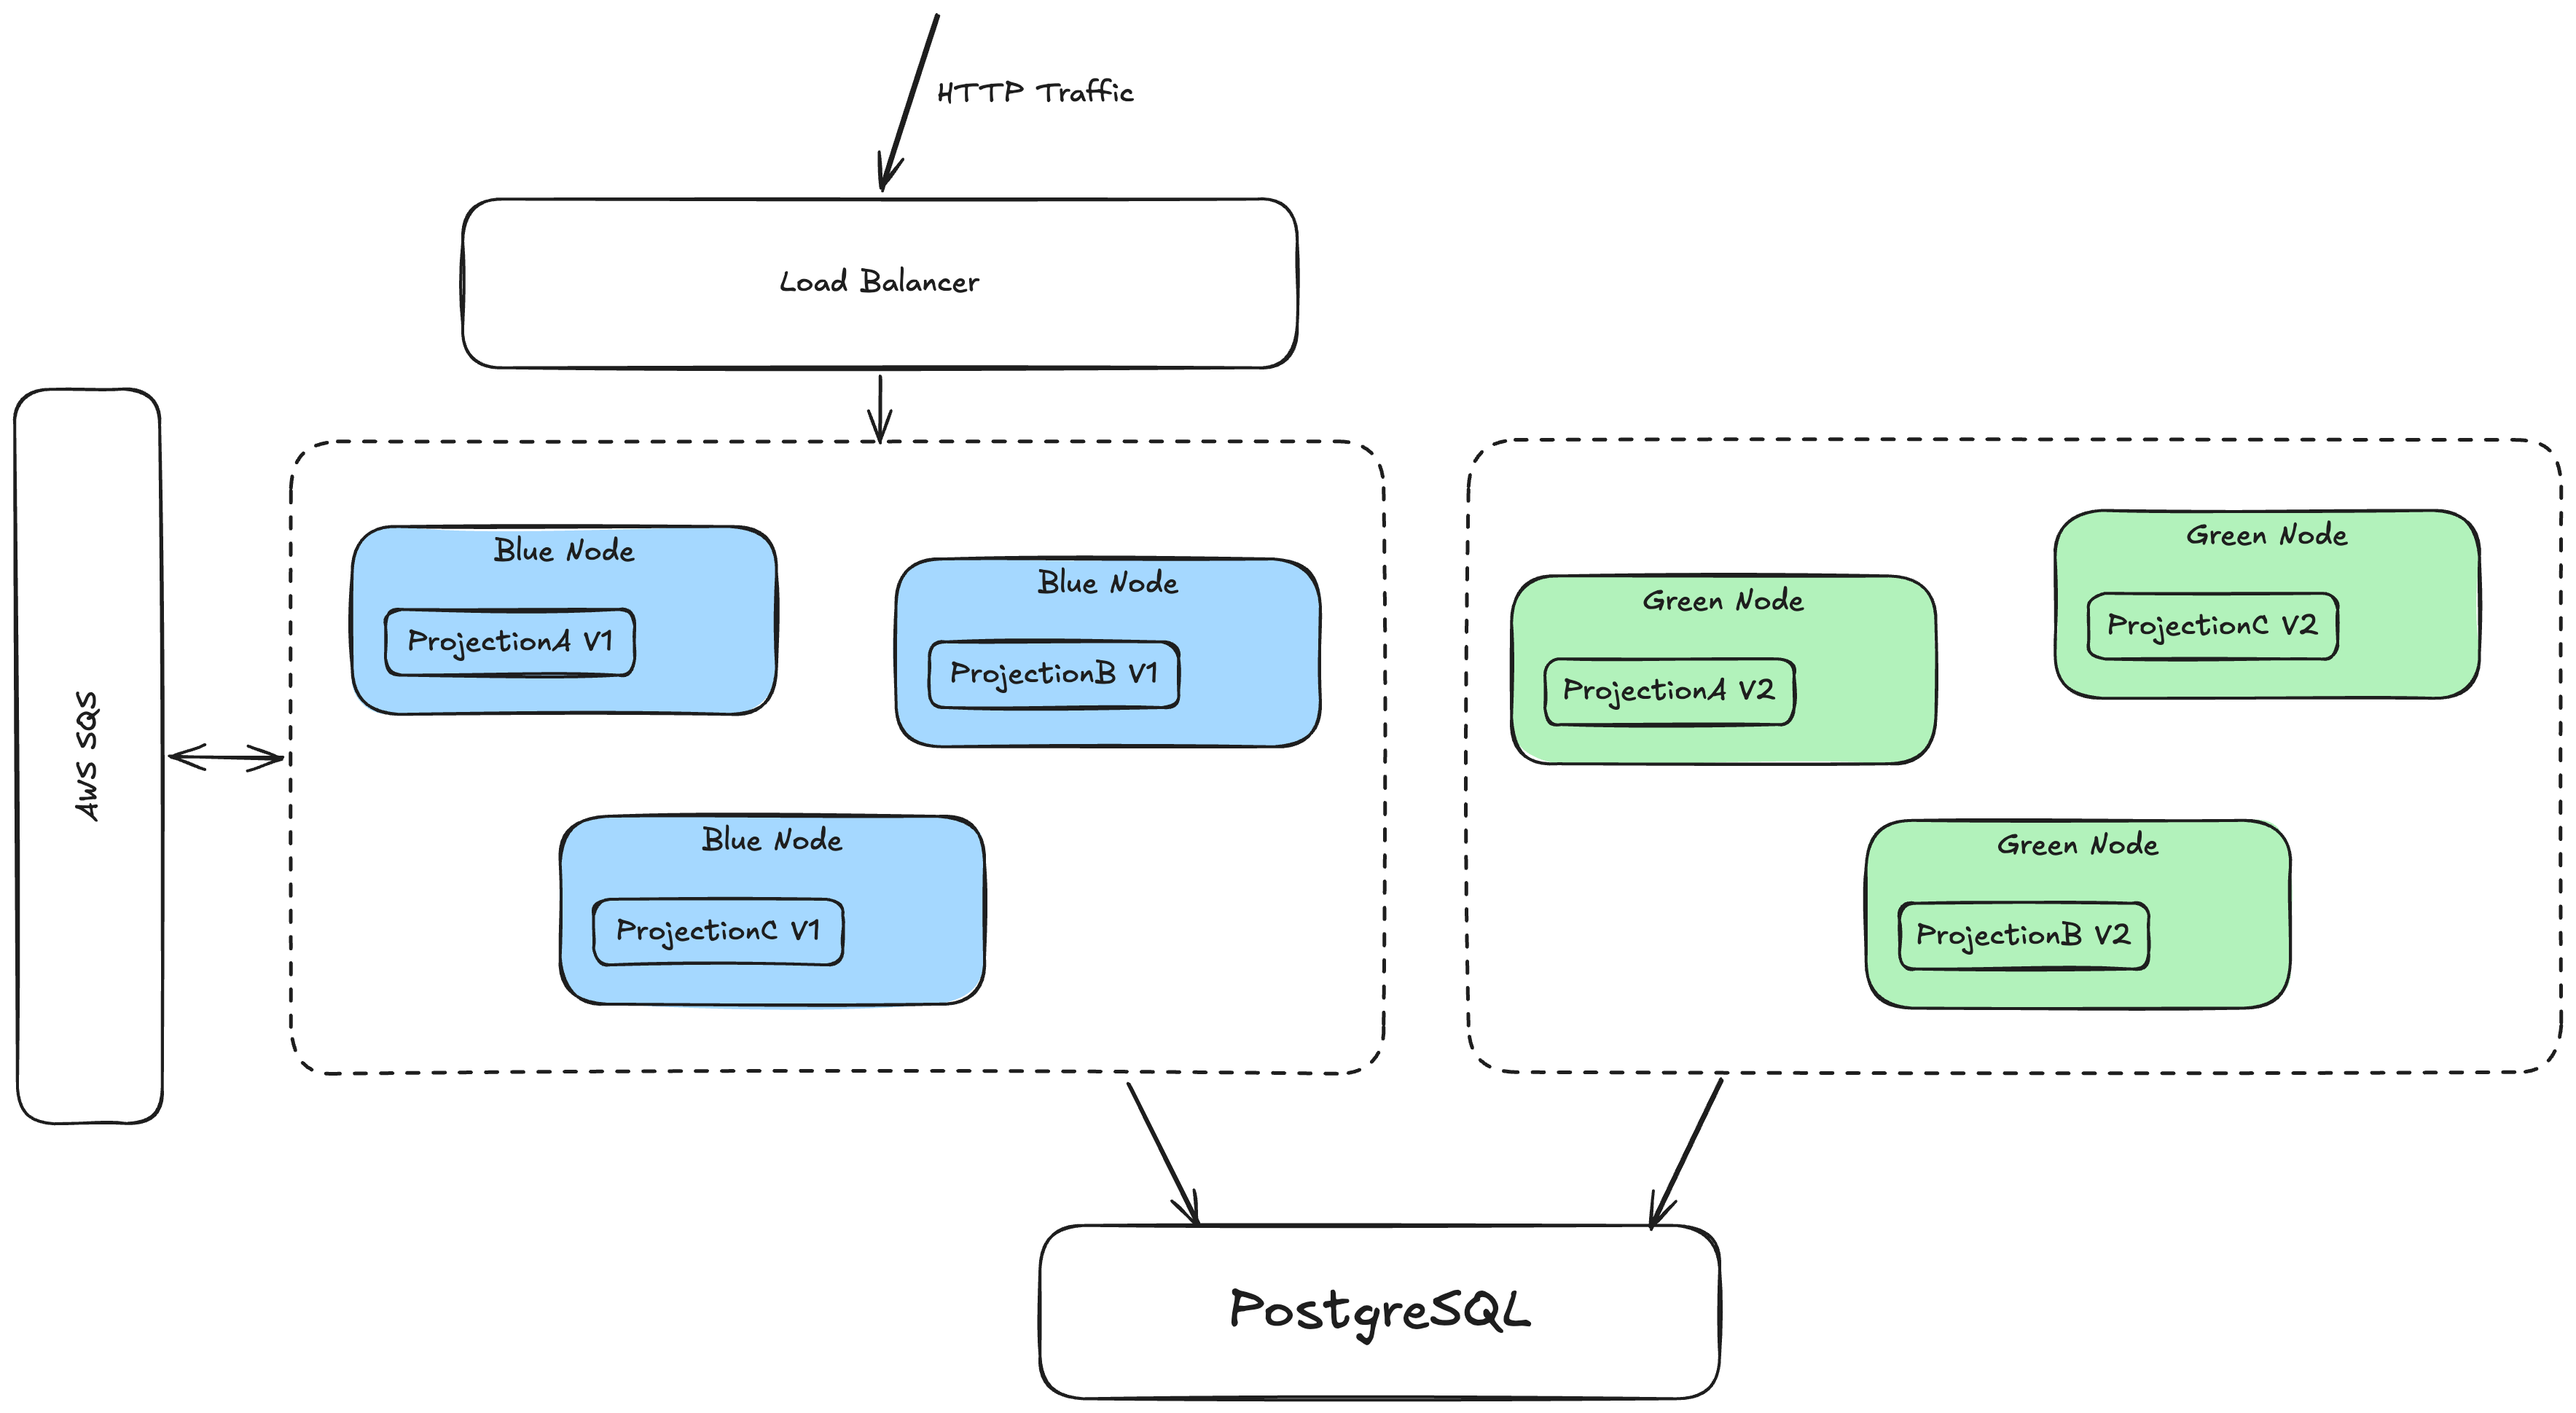
- Rebuilding Projections Without Downtime covers blue/green deployment. Agents are only ever assigned to nodes that actually have the code for that projection version, and dedicated warm-up nodes can catch a new version up off to the side without publishing side effects or handling production messages
- Tenants Taking Turns is the memory side of running thousands of tenant agents in one process
- Improving Wolverine Through Chaos Testing is how we keep it that way
On top of the assignment work, the projections themselves got a lot better at recovering without help. When a projection fails in production, the daemon pauses that shard and classifies why: your code threw on a particular event, an event couldn't be deserialized, an event type is unknown to this deployment, two processes are fighting over the same shard, or something else like a database outage. If the failure is transient (a timeout, a failover, a connection pool that ran dry), Wolverine restarts the shard on its own with an increasing backoff. If it's a genuine poison event, Wolverine leaves it paused, because restarting would just fail on the same event forever, and reports exactly which event and which exception did it.
And all of this is tested the way you'd hope. The leader's real evaluation code runs against a simulated cluster with seeded chaos (nodes joining, leaving, dying mid-rollout) for thousands of rounds, asserting at every step that no agent ever runs on two nodes. There's a fleet-scale test at 62,400 agents that fails the build if assignment gets slow again.
What CritterWatch adds
Everything up to this point is open source, MIT licensed, and in the box. Wolverine keeps your projections running. What it can't do is show you a picture, let you reach in and change something at runtime, or tell you about the problems that can only be seen from outside the application. That's the job of CritterWatch, our commercial management console.
See where everything is running
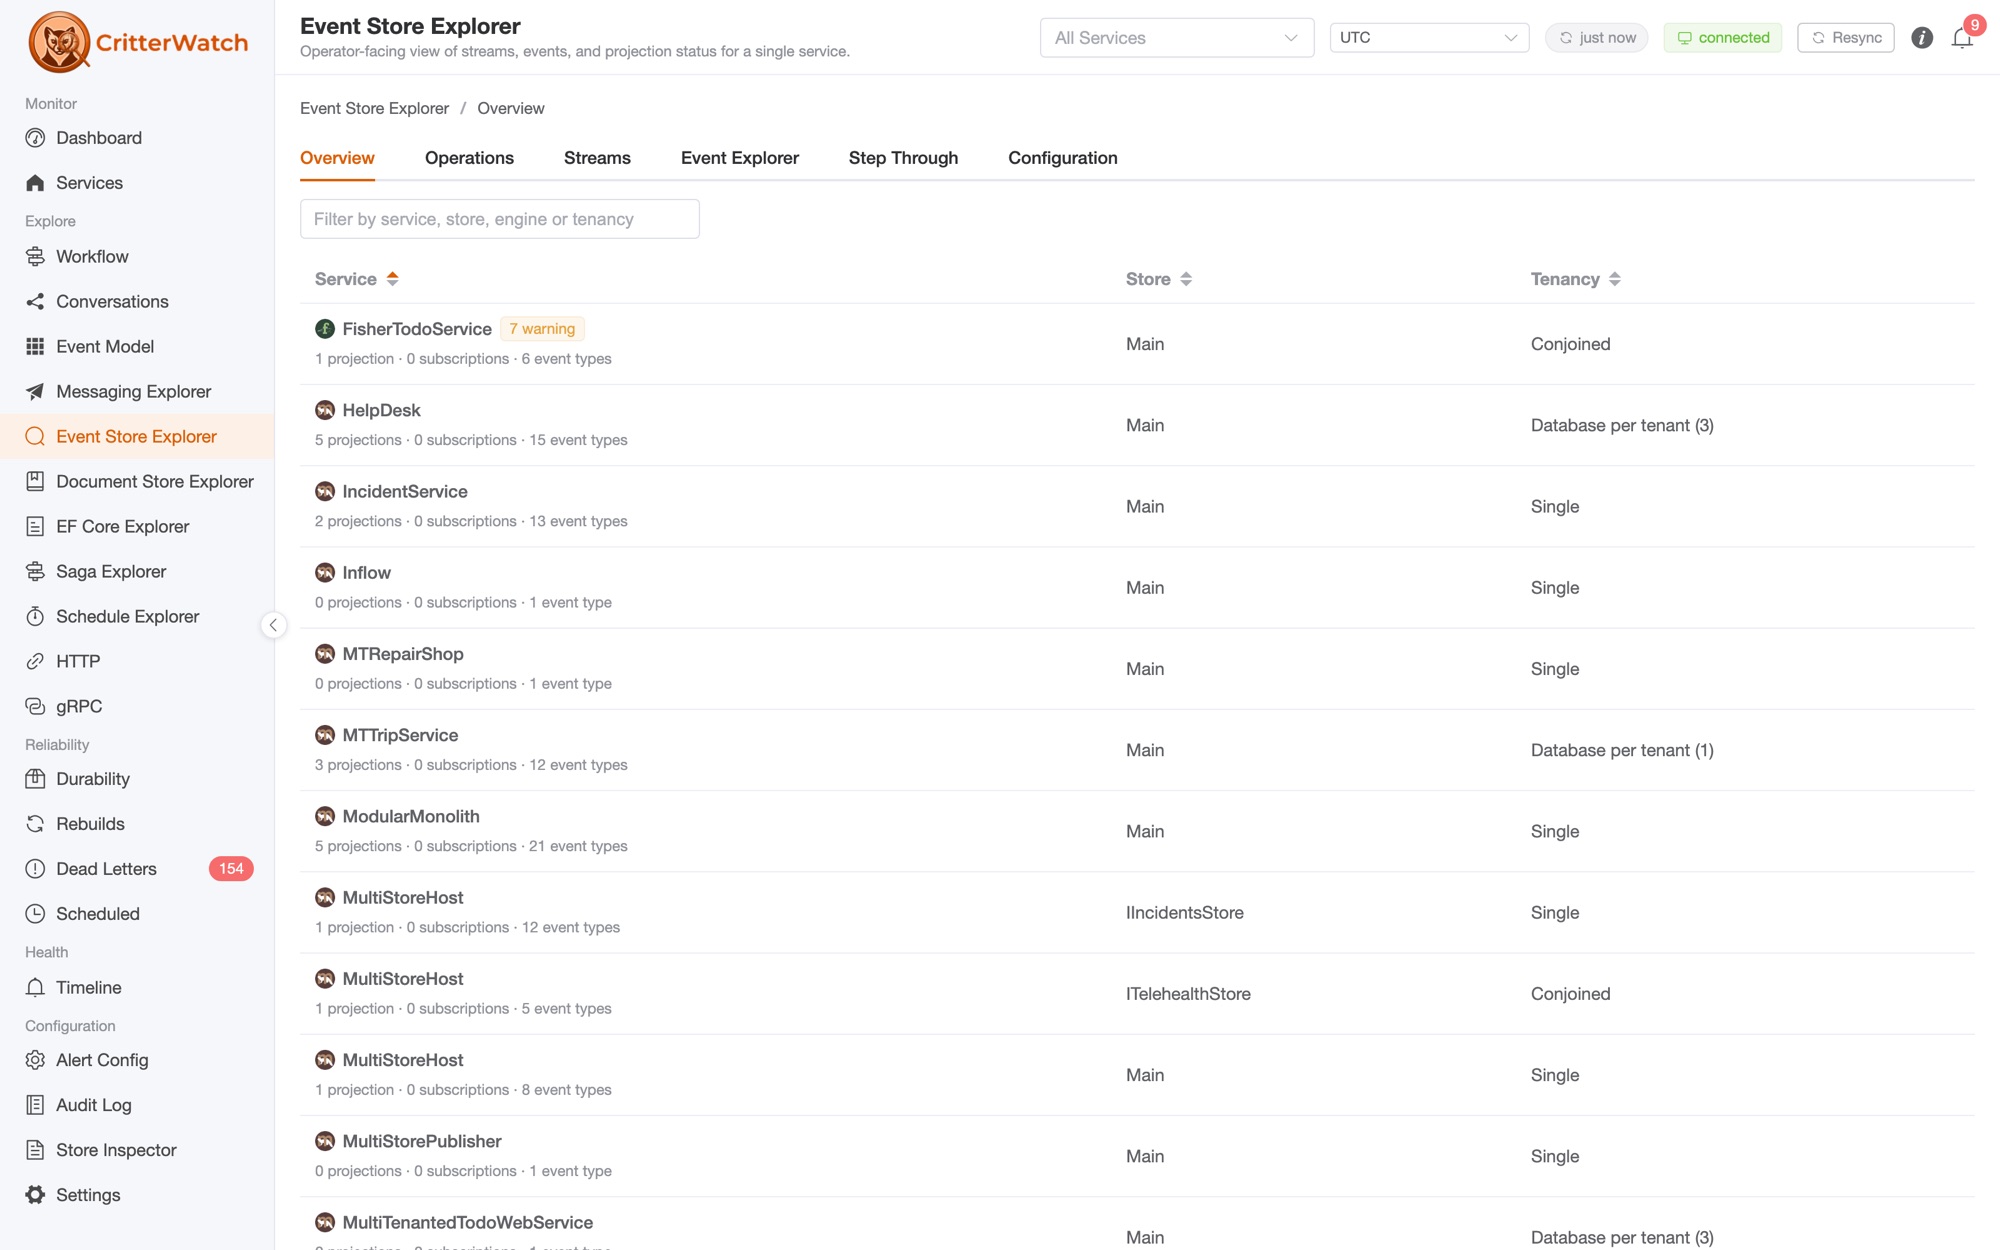
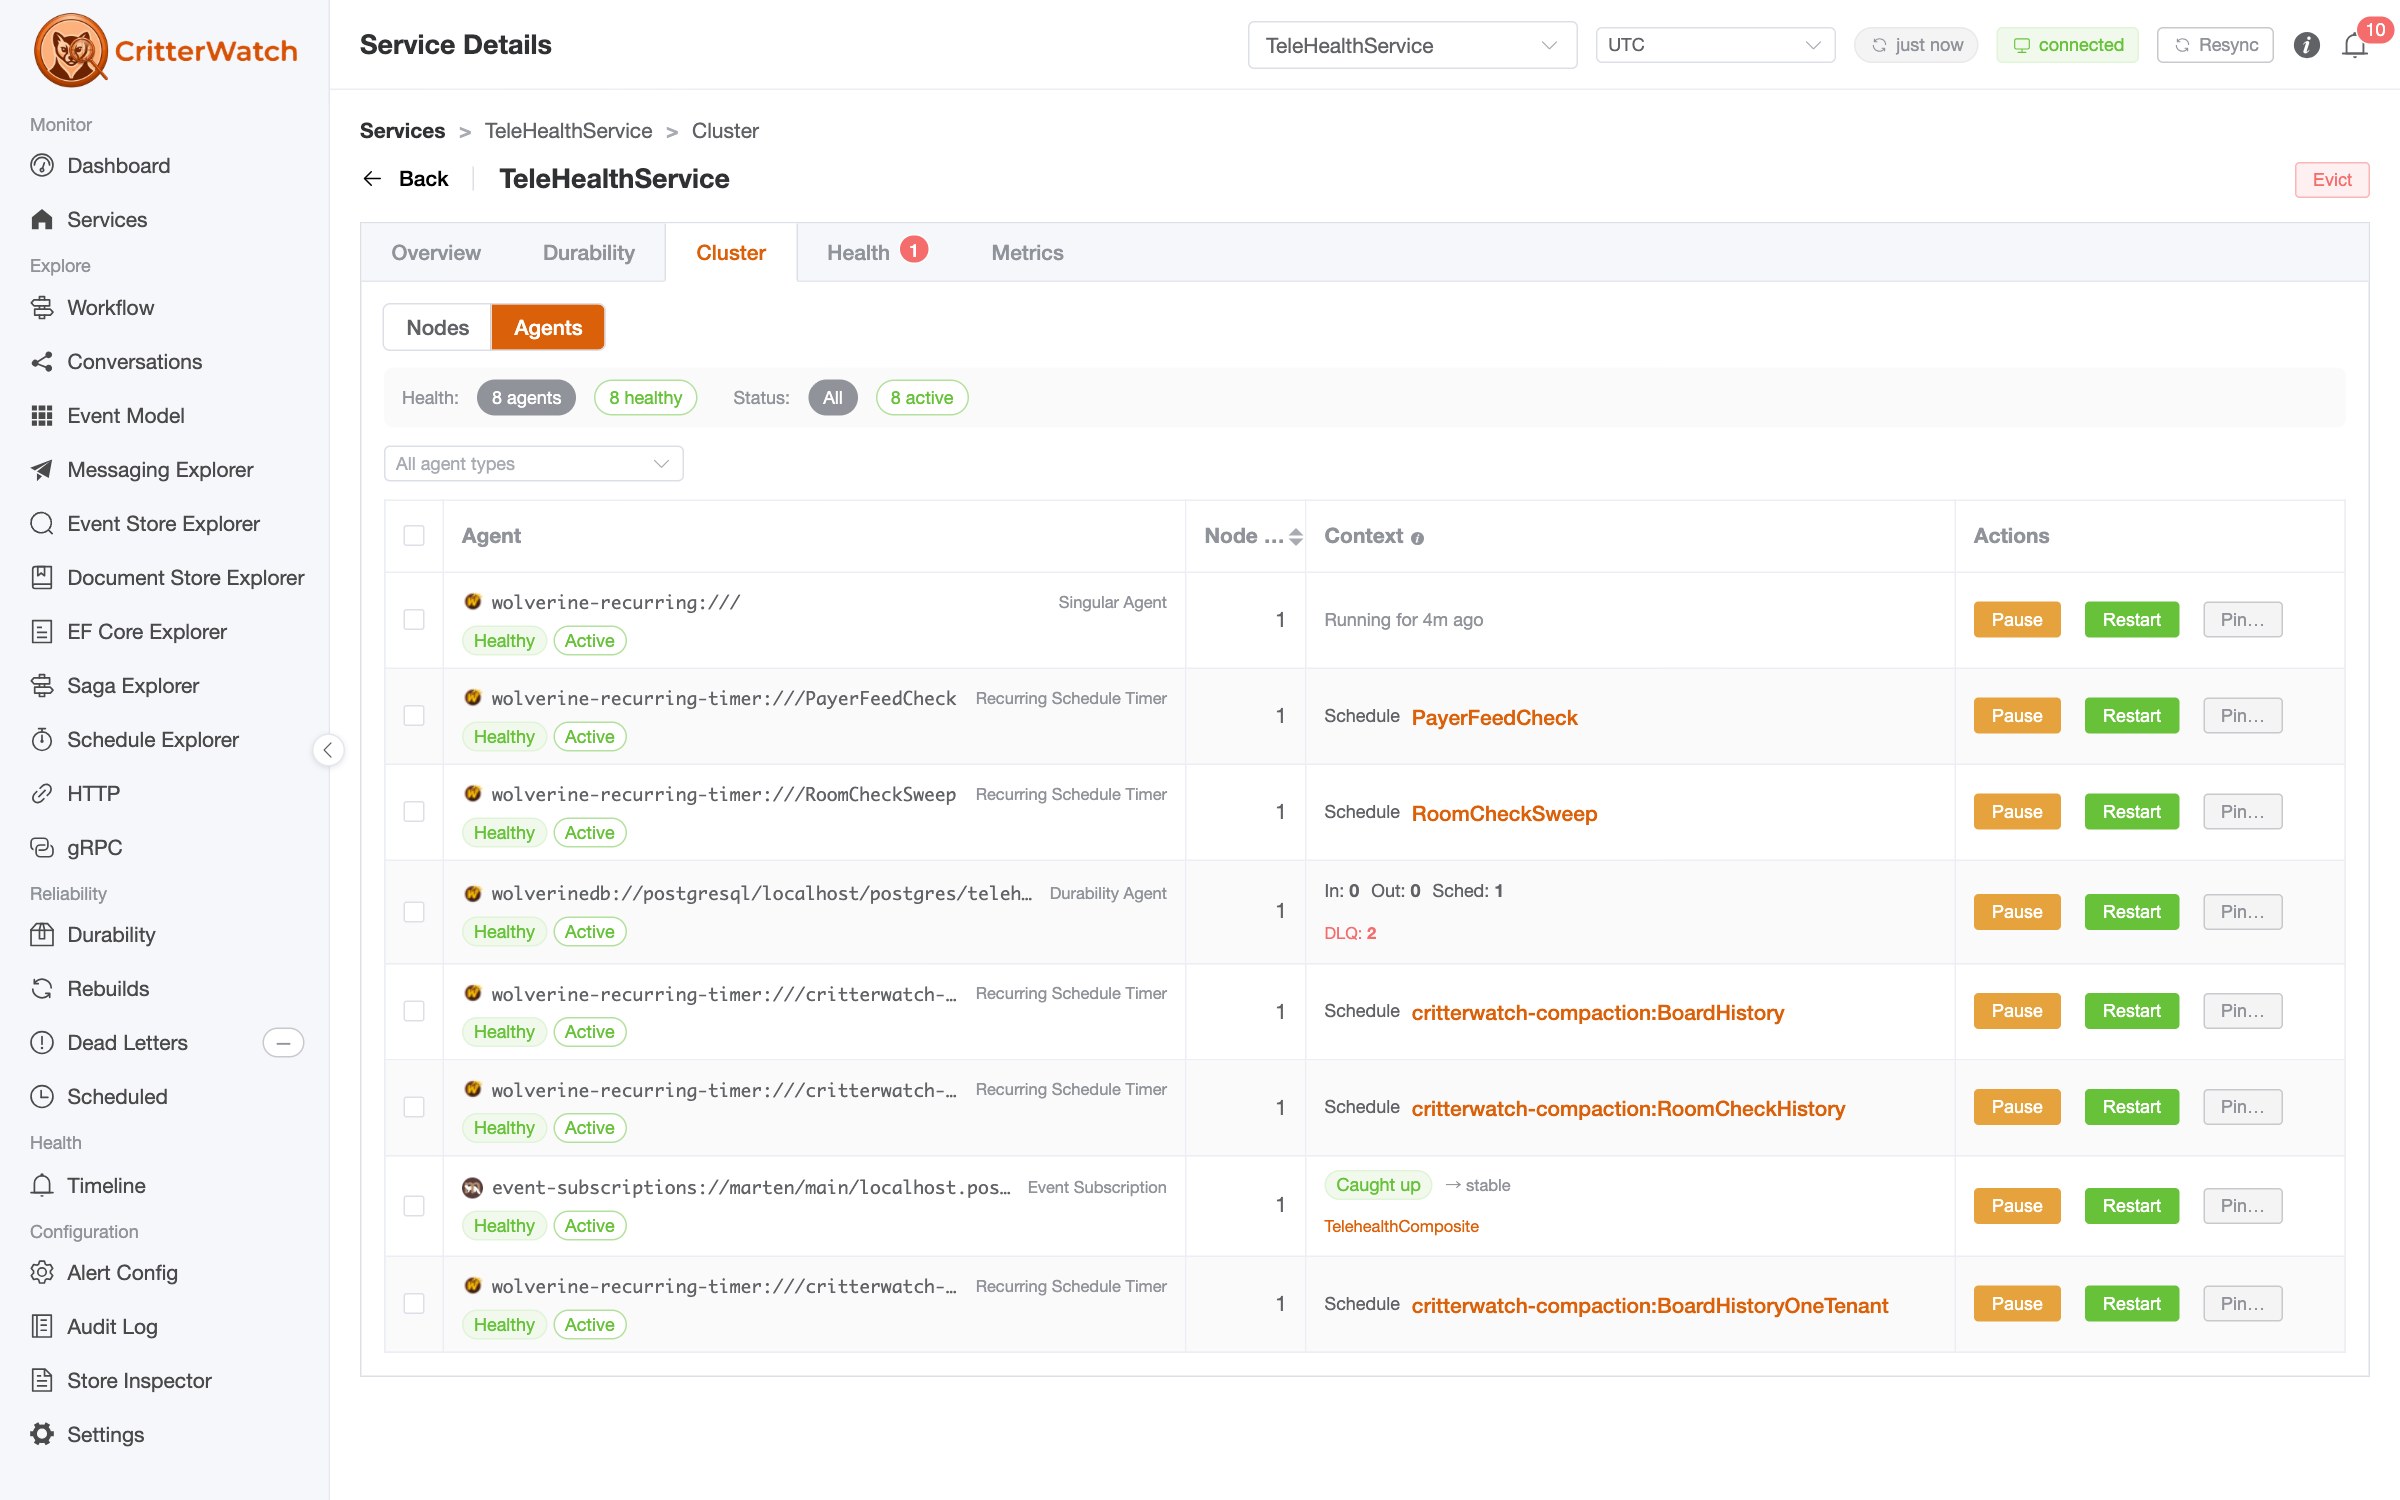
The Cluster tab for each service lists every node with its heartbeat, uptime, which node is the leader, and how many agents it's carrying. Flip to the Agents view and you get every agent with its owning node, its health, and whether it's paused, pinned, or unplaced. And if an agent is unplaced, the reason why.
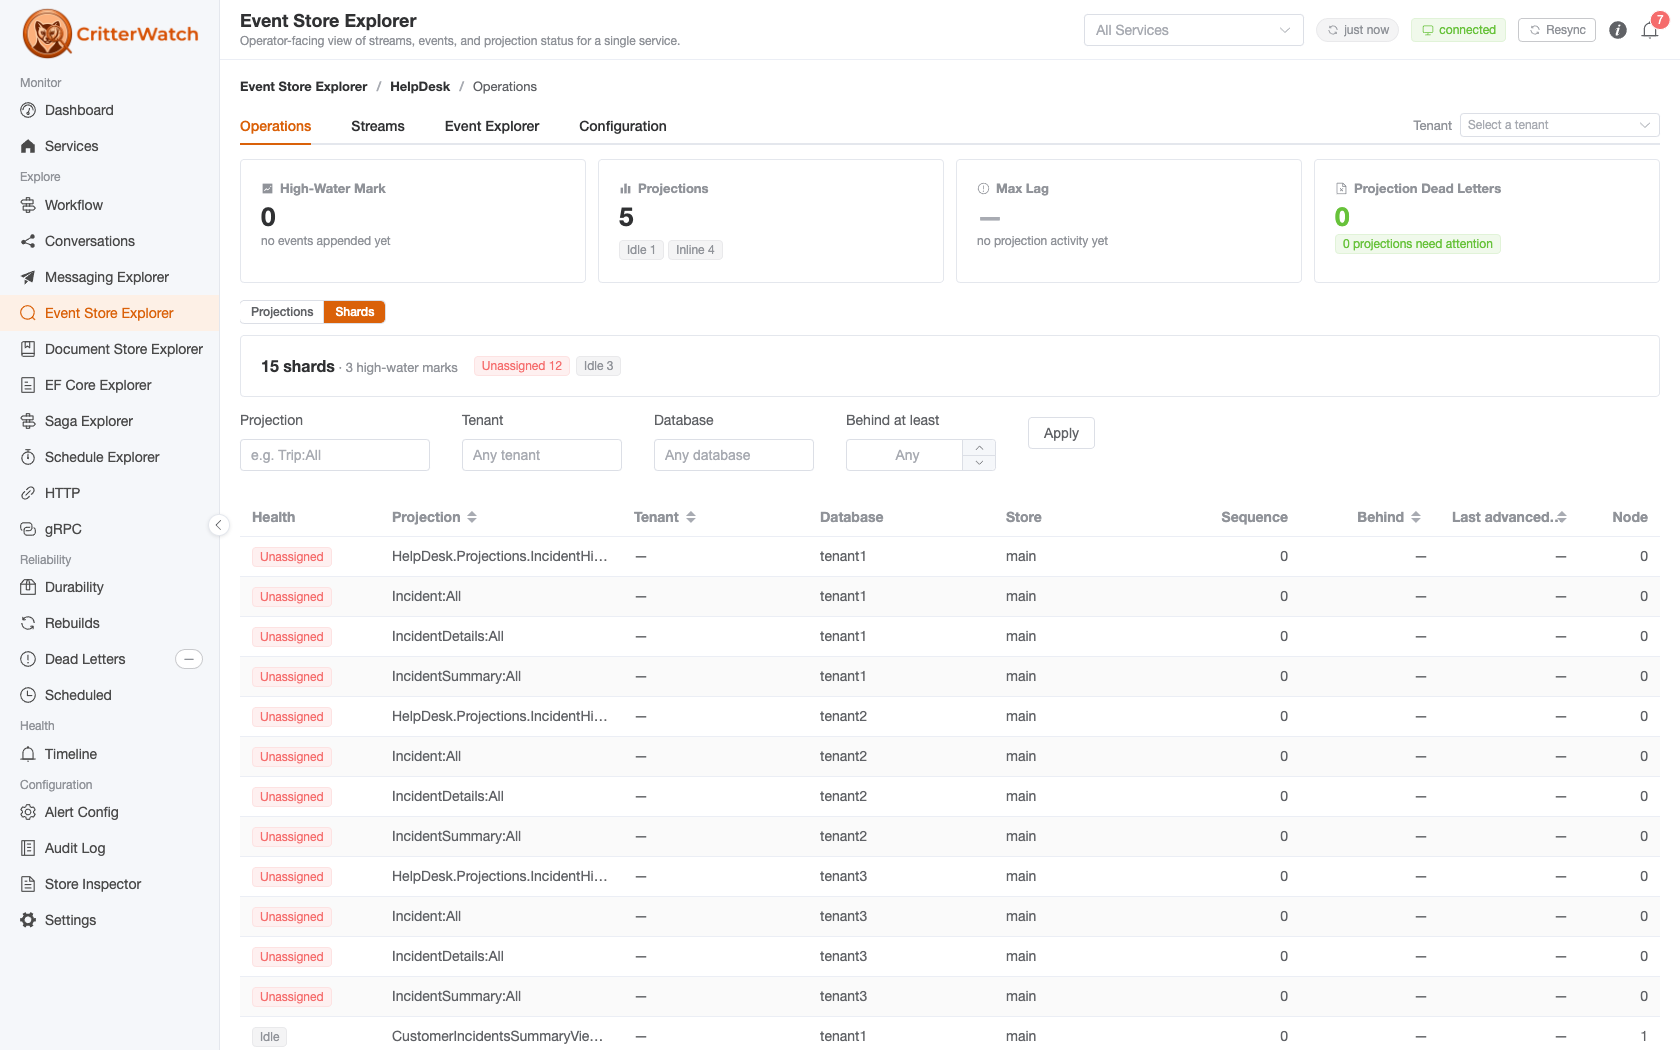
From the event store side, the Operations tab shows every projection shard, by database and by tenant, sorted worst first, with the node that's running it. In a system with thousands of tenants, "worst first" and server side paging matter quite a bit.
During a blue/green rollout, a rollout panel appears for any projection with two live versions showing the old version against the new one, how many shards are left to catch up, the rate, and an ETA.
Take control when you need to
Automatic is great right up until you know something the leader doesn't. From the console you can:
- Pause and Restart any projection, subscription, or individual shard, or do it in bulk with "Restart All Paused" and "Restart All Stale"
- Rebuild a projection right now, schedule the rebuild for 3 AM, or rebuild it for every tenant
- Rewind a subscription to the beginning, a sequence number, or a point in time
- Pin an agent to a specific node, and unpin it later
- Eject a misbehaving node so its agents are redistributed, or trigger a new leader election
- Clean up the progress rows left behind by retired projection versions
Every one of those lands in the audit log, and goes through CritterWatch's role based permissions if you've turned those on.
A lot more health monitoring
Marten and Wolverine do ship health checks by themselves of course. Marten has an async daemon check for projection lag and a high water mark check, and Wolverine reports on its nodes and listeners. They're good at what they're for, which is giving Kubernetes or a load balancer a yes or no answer about one process.
But a health check inside a process can only tell you about that process. It can't tell you about a projection that no process is running. It can't notice that an agent has bounced between two nodes four times in the last two minutes. It can't see that a node stopped emitting heartbeats, because that node isn't answering questions anymore. Those are fleet level conditions, and you need something watching the fleet to catch them.
CritterWatch gives every projection shard an interpreted state rather than a raw number: Healthy, Catching Up, Stalled, Failing, Conflicted, Unassigned, Paused, and a few more. Some of the distinctions it makes are subtle but important:
- Stalled means the shard is behind a high water mark that is still moving and hasn't advanced in five minutes. A projection that's caught up on a quiet system is never "stalled", which gets rid of the classic false alarm at 2 AM when nothing is happening
- Unmeasurable is not zero. If CritterWatch can't establish how far behind a shard is, it says so. It will never show you a comforting
0it can't back up - Conflicted means two processes are fighting over the same shard, and a restart will not fix it
- Lag is shown in events and in time ("oldest pending 3m 05s"), with a rate, an ETA, and a one hour backlog trend
Then there are the alerts. Here are just the ones that apply to projections and agent distribution:
| Alert | What it catches |
|---|---|
ProjectionLag | A shard is too far behind, with warning and critical thresholds you set per service or per shard |
ProjectionStale | A shard has stopped advancing, optionally with a one-time automatic restart |
ProjectionLagUnmeasurable | No high water mark is being reported for a shard's scope |
ProjectionPaused | Warning if a person paused it, critical if the daemon did because of a failure |
ProjectionAgentUnassigned | A registered projection that nothing is running |
AgentUnplaced | The leader couldn't place an agent, with the reason: waiting on capacity, or no node has the code |
ShardOwnershipConflict | The node reporting a shard keeps alternating |
AgentReassignmentStorm | Agents are being moved around more than they should be |
NodeFlapping | Nodes are being ejected and rejoining repeatedly |
NodeOverloaded | A node has been over its capacity threshold under capacity-aware assignment |
NodeRuntimePressure | CPU or managed heap pinned high for five minutes |
HighWaterStale / HighWaterMarkFrozen | The high water detection itself has stopped or is stuck behind committed events |
AgentDown / ServiceOffline | Something has stopped reporting altogether |
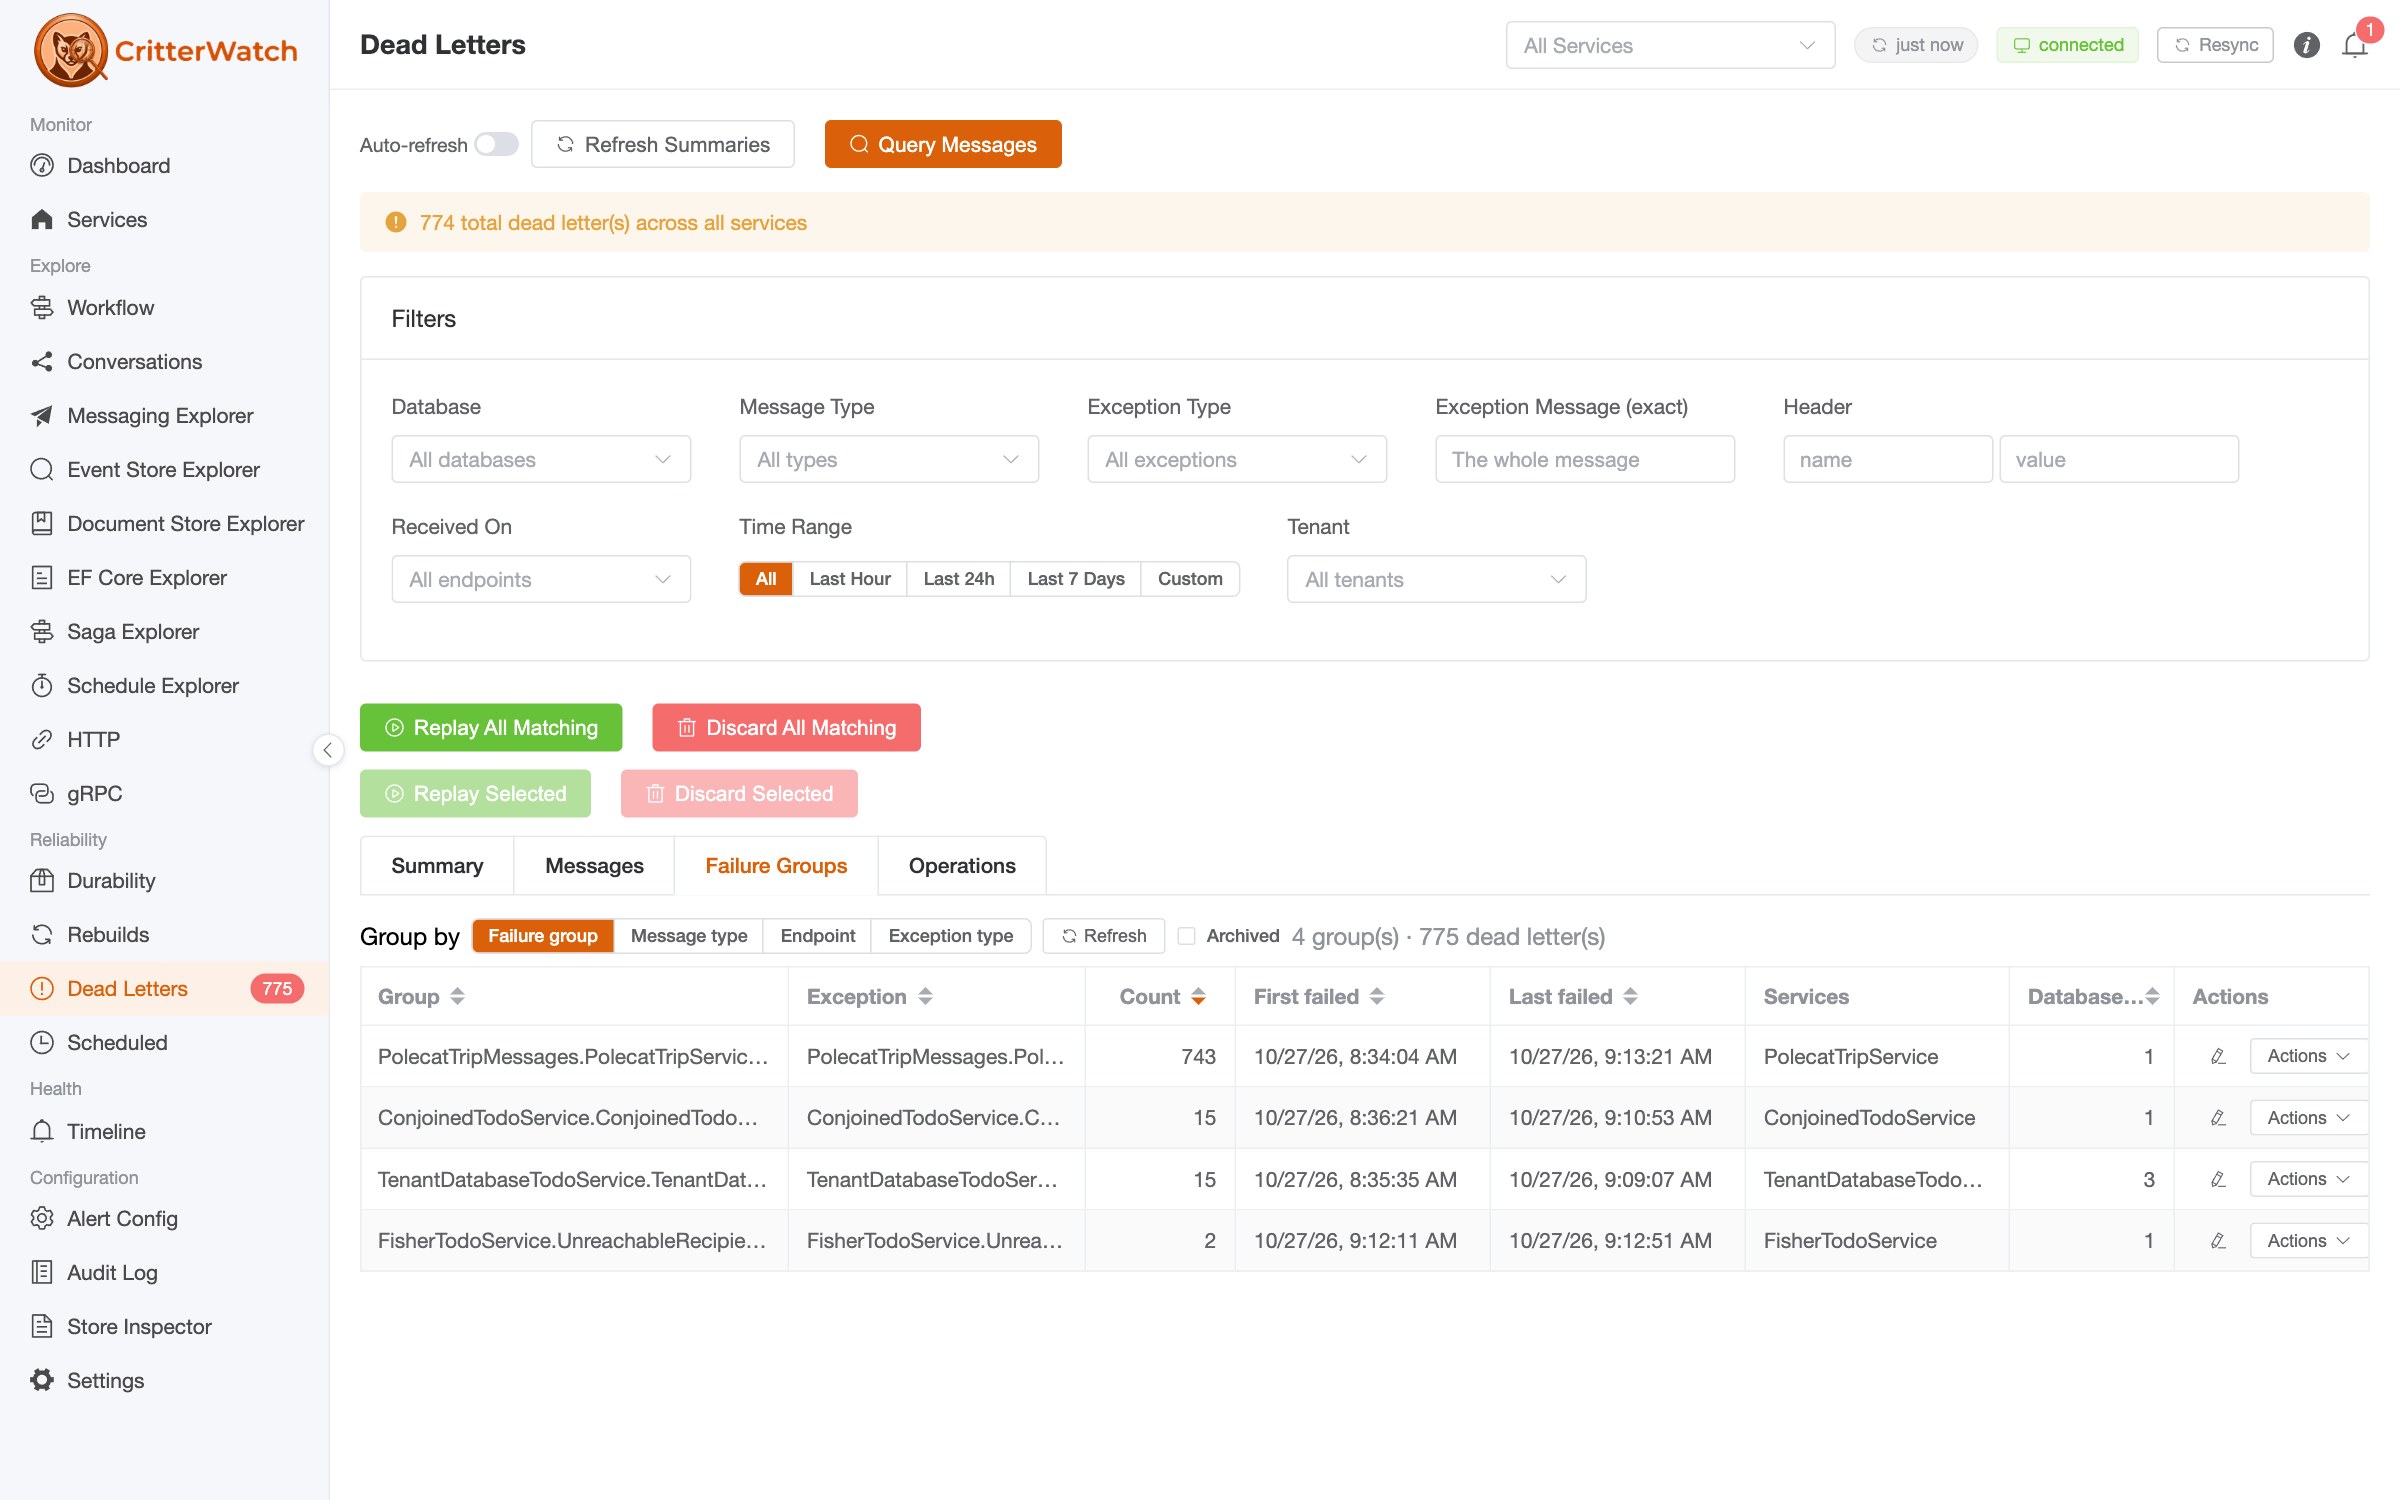
If you read the agent assignment post, that list should look familiar. AgentReassignmentStorm and NodeFlapping are the production problems from that post turned into alerts, so the next team doesn't have to work it out from log files the way we did.
Alerts can be tuned per service and per shard, rolled up so that 2,000 tenants with the same problem don't send 2,000 notifications, and routed to Slack, Discord, Microsoft Teams, PagerDuty, or email. I wrote more about how alerting works in CritterWatch back in August.
MCP tools and LLM callouts
There are two different ways AI shows up here, and I want to be careful to keep them separate. One is your AI agent asking CritterWatch questions. The other is CritterWatch asking a model for a second opinion.
Your agent, with a real control surface
CritterWatch ships an MCP server that you mount with two lines:
builder.Services.AddCritterWatchMcp();
// ...
app.MapCritterWatchMcp();
Point Claude Code or any other MCP client at it and the agent can investigate the same things you would in the console, across every monitored service at once. For projections and distribution specifically:
get_service_healthreturns a service's running nodes and agent assignmentsget_projection_lagandlist_shard_healthreturn shards worst first with the verdict, the gap, the tenant, the database, the owning node, and any latched errordiagnose_projectionexplains why a specific projection is in the state it's inrun_projection_stepperreplays your production projection code over a slice of real events and reports the state before and after each one, without writing anything.get_projection_apply_sourcethen hands the agent the exactApplymethod that ranlist_high_water_loopsshows the high water detection per nodelist_active_alertsandsummarize_active_alertsreturn what's currently firing
So "why is the Invoice projection behind for tenant 417, and which node is it on?" stops being twenty minutes of clicking and log searching. The agent calls list_shard_health, sees a shard paused with an ApplyEvent failure on a specific event, steps the projection over that event, reads the Apply method, and comes back with the line of code and a proposed failing test. We recorded a session like that in Interrogating Your System with CritterWatch's MCP Server.
The agent can act, too: pause_projection, restart_projection, rebuild_projection, and schedule_projection_rebuild are all there. Since handing an LLM the keys to production deserves some care:
- Every tool is marked read-only or destructive, and goes through the same role based permissions as the console
- You can run the whole server read-only with
AddCritterWatchMcp(o => o.ReadOnly = true), in which case the action tools aren't even listed - Irreversible tools require a single-use confirmation token issued by the server and bound to the exact arguments
- Everything an agent does is in the audit log, marked as coming through MCP
- The cluster-shaping actions (pinning agents, ejecting a node, forcing an election, rewinding a subscription) are deliberately console only for now
CritterWatch asking a model
Going the other direction, CritterWatch can call out to a language model itself for alert triage. This is built on the LLM callouts we added to Wolverine, and it's off until you turn it on and hand it your own IChatClient. We don't pick the model vendor for you.
The useful part is correlation. When things go wrong in a cluster, they go wrong in bunches. A node gets ejected, forty agents move, six projections go stale, and a lag alert fires for each of them. CritterWatch already batches alerts that fire together, so with triage enabled the model is shown that whole batch as one possible incident and writes back a one line summary, an assessment in plain operator language, and suggestions. Something like "these six stale projections all started after node 3 was ejected, and they share a database, so look at the node before you restart anything" is exactly the kind of connecting of dots that a tired human at 2 AM is bad at.
A few things we were deliberate about:
- The narrative shows up on the alert card clearly labeled "AI ASSESSMENT — SUGGESTION ONLY, NOT A DIAGNOSIS", and gets threaded into Slack or your other notification channels with the same label
- The model can't do anything. A suggestion can only highlight a button the console already offers for that alert, like "Restart projection", and pressing it goes through the normal permission check. Anything the model makes up is discarded on the server
- Nothing in CritterWatch reads the narrative to make a decision. No alert is raised, cleared, or escalated because of what a model said
- There's a token budget, because an alert storm is exactly when this fires the most
I think of it as a colleague leaning over your shoulder saying "have you looked at node 3?" It's often right, it's occasionally wrong, and either way you're still the one driving.
Try it
If you're already using Marten or Polecat with Wolverine, the managed distribution is one line of configuration away, and it's the first thing I'd turn on before going to production on more than one node:
.IntegrateWithWolverine(m => m.UseWolverineManagedEventSubscriptionDistribution = true);To add CritterWatch:
dotnet add package Wolverine.CritterWatch   # in each monitored service
dotnet add package CritterWatch             # the console, PostgreSQL flavor
Monitoring in CritterWatch is free: every dashboard, every explorer, every health state described above. A license is required for the state-changing actions and for the MCP server.
- CritterWatch docs: critterwatch.jasperfx.net
- Plans and pricing: jasperfx.net/our-products/#critterwatch-plans
- Projection distribution docs: wolverinefx.net
How JasperFx can help
Nearly everything in this post exists because a team running the Critter Stack in anger brought us a hard problem and stuck with us while we worked through it. The database affinity, the capacity-aware assignment, the warm-up nodes, and a good share of those CritterWatch alerts all started life as somebody's production incident.
If you're heading toward that kind of scale, or you'd just rather not find the edges by yourself, a JasperFx support plan gets you direct access to the people who built all of this, and our consulting services run from architecture reviews through hands-on work in your cluster. You can also just come talk to us in the Critter Stack Discord. We're a friendly bunch.